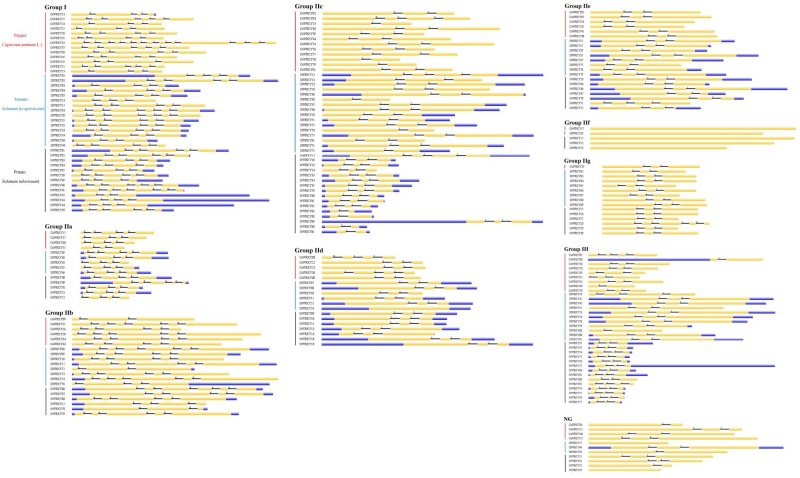
FIGURE 2.
The group-wise analysis of WRKY gene structures from pepper (Capsicum annuum; CaWRKY), tomato (Solanum lycopersicum; SlWRKY), and potato (Solanum tuberosum; StWRKY). The upstream/downstream, exon and intron are shown with blue rectangle, yellow cylinder and black line, respectively. Intron phase numbers (0, 1, 2) are labeled on the top of each WRKY gene sketch map.

