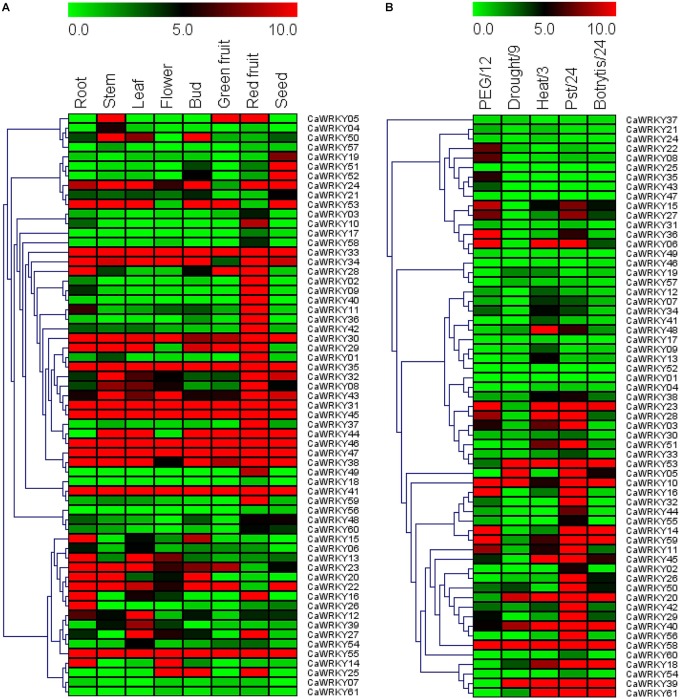
FIGURE 6.
Expression profiles of 61 CaWRKY genes in various pepper tissues (A) and under different biotic/abiotic stresses (B). (A) CaWRKY gene expression was determined by RT-qPCR. CaWRKYs are indicated as rows and tissues as columns. Green, black and red elements represented down-regulated, no change and up-regulated, respectively. (B) CaWRKY gene expression was determined by RT-qPCR. CaWRKYs are represented as rows and stress treatment/time point as columns (PEG/12: 20% PEG6000 for 12 h; Drought/9: Water withheld for 9 days; Heat: 42°C for 3 h; Pst/24: PstDC3000 infection for 24 h; Botrytis/24: Botrytis cinerea infection for 24 h. The vertical dendrograms represent the similarity degree of tissue expression profile (A) and stress response profile (B) among the 61 CaWRKY genes.

