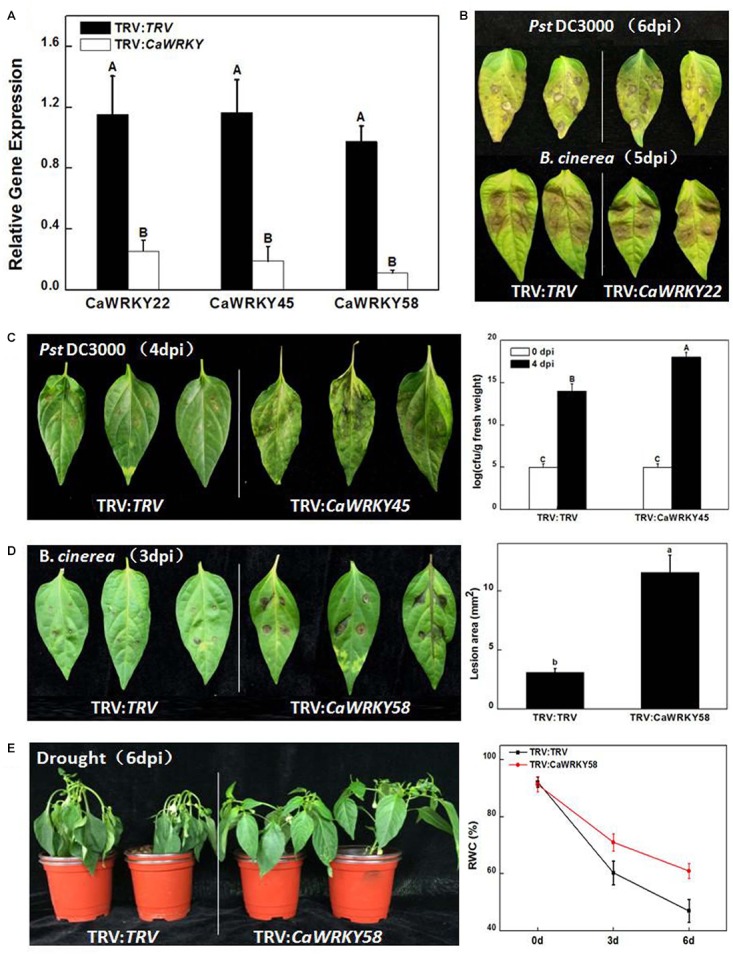
FIGURE 7.

Functions of the CaWRKY genes in disease resistance and abiotic stress responses indicated by Virus induced gene silencing (VIGS). (A) Silencing efficiency. Pepper plants infiltrated with Agrobacterium suspensions carrying an empty pTRV vector served as control plants. Expression levels of CaWRKYs in control and VIGS-treated plants were detected by RT-qPCR assays. (B) PstDC3000 (Up) and B. cinerea (down) infections. Photographs were taken at 6 dpi days past inoculation) and 5 dpi, respectively. (C) Enhanced susceptibility to PstDC3000. pTRV-control plants (TRV:TRV) and CaWRKY45-silenced plants (TRV:CaWRKY45) were inoculated with PstDC3000 and the picture was taken at 4 dpi (Left). According to DMRT (Duncan’s multiple range test), means of the colony-forming units (cfu) in leaves of TRV:CaWRKY45 is significantly higher than control at 4 dpi (P < 0.01) (Right). (D) Enhanced susceptibility to B. cinerea. TRV:TRV and TRV:CaWRKY58 plants were inoculated with B. cinerea and the photograph was taken at 3 dpi (Left). Lesion diameter was measured and statistically calculated for all plants. Significant difference between lesion diameters of the silenced plants and that of the control plants is indicated at P < 0.05 according to DMRT (Right). (E) Drought stress response. Phenotypes of the CaWRKY58-silenced and control plants after withholding water for 6 days (Left). Comparisons of TRV:CaWRKY58 and TRV:TRV control plants at 6th day after drought treatment. Twelve plants were used for each treatment. The experiments were conducted three times independently. Values represent mean ± SD (n = 3).
