
Figure 3.
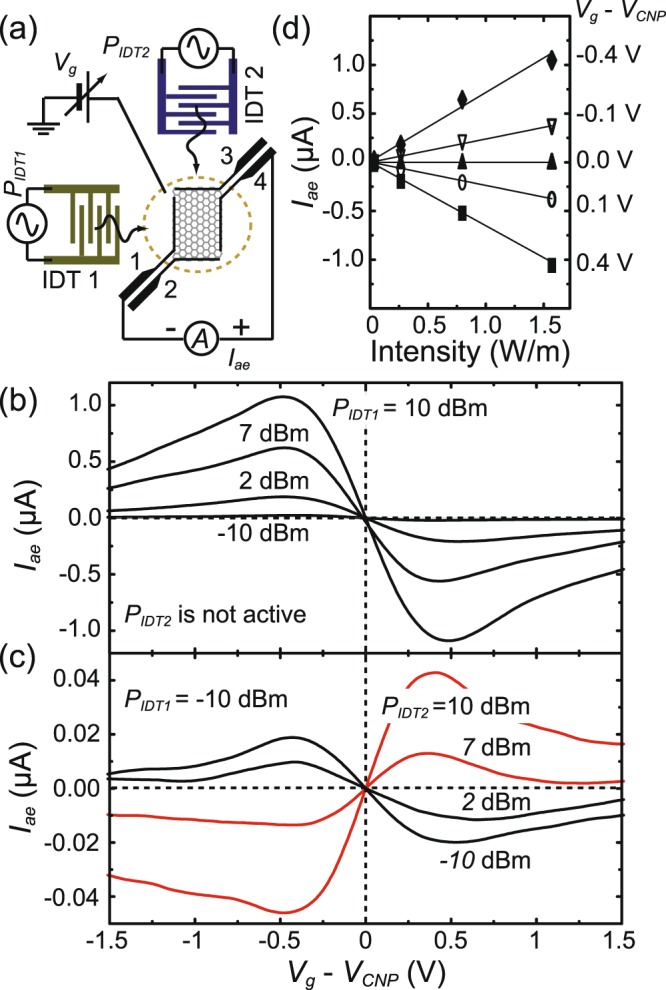
Acoustoelectric characteristics of the device. (a) The schematic plot of the Iae measurement setup. (b) The quiescent performance of acoustoelectric current Iae as a function of Vg at different RF-power PIDT1 applied on ITD1 at 191 MHz. Note that IDT2 remains unactivated. The majority carriers change from p- to n- type as the Fermi level is tuned across CNP, which causes a sign reversal of Iae. (c) Iae versus Vg traces with various PIDT2 applied on IDT2. Here PIDT1 is kept at −10 dBm and both IDTs are operated at 191 MHz. When PIDT2 increases larger than 2 dBm, the polarity of measured Iae changes. (d) Acoustoelectric current as a function of PIDT1 at various Vg. Data are extracted from (b).