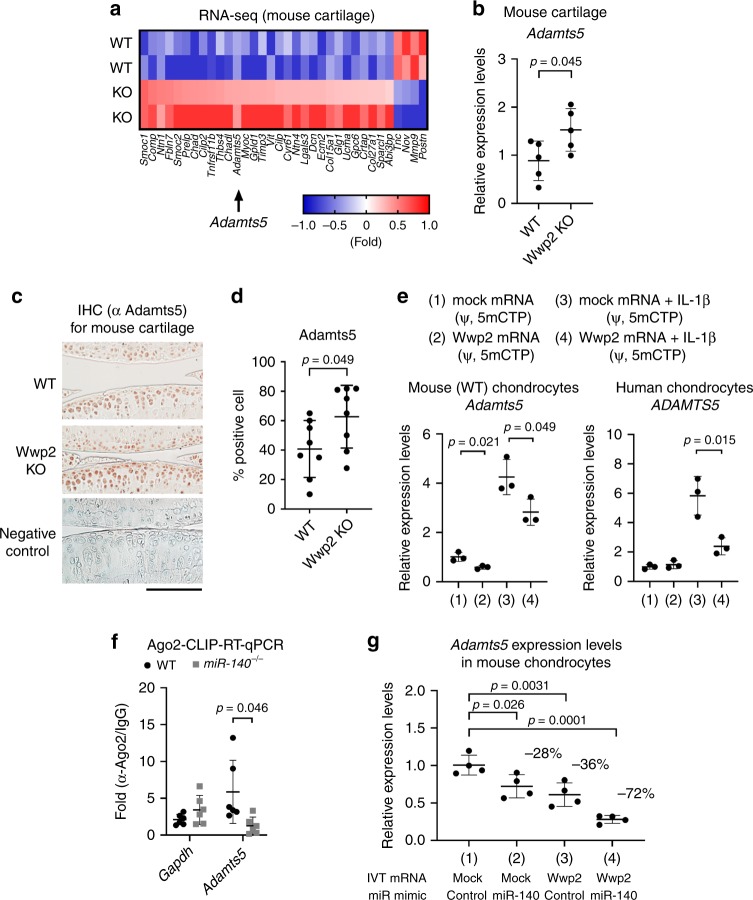
Fig. 3.
Wwp2 regulates Adamts5 expression in articular cartilage. a RNA-seq analyses of 2-month-old articular cartilage comparing WT and Wwp2 KO mice. Each samples were isolated from three individual mice. After normalization, Genes with count values ≥ 2000 and a change ≥ 1.5-log2fold were extracted and used for analysis. A heat map showing proteinaceous extracellular matrix related genes, classified by DAVID analysis. b RT-qPCR for 2-month-old mouse articular cartilage (n = 5, Student’s t test, normalized with Gapdh). c, d IHC staining of Adamts5 for mouse articular cartilage (6-month-old). c Representative images. Adamts5 was stained with AEC (red). Negative control was stained using rabbit control IgG. d Adamts5 positive cell rate (n = 8, Student’s t test). e Wwp2 overexpression experiments using in vitro transcribed (IVT) mRNA (ψ, 5mCTP) with or without IL-1β (10 ng/mL, 17 h) for mouse and human chondrocytes, whose Adamts5 and ADAMTS5 expression levels were analyzed by RT-qPCR (n = 3, Student’s t test, normalized with Gapdh and GAPDH, respectively). f Ago2-crosslinking immunoprecipitation (CLIP) analyses of primary chondrocytes to detect Ago2-binding mRNAs, compared between WT and miR-140-/- mice (n = 3, Welch’s t test). The primers were designed for the 3′ untranslated region of Adamts5 gene and a coding region of Gapdh. g Double overexpression experiments using IVT Wwp2 mRNA (ψ, 5mCTP) and miR-140 mimic in mouse chondrocytes. RT-qPCR for Adamts5 expression levels (n = 4, Dunnett test compared with WT and DKO, respectively, normalized with Gapdh). Black scale bar = 1 mm. Source data are provided as a Source Data file. Data are presented as the mean ± SD

