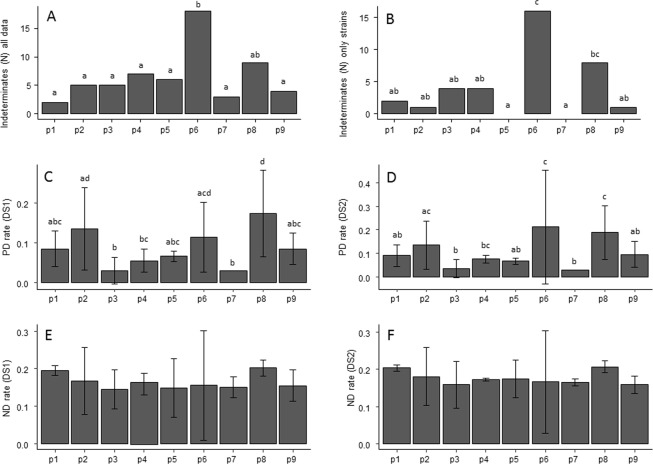
Figure 1.
(A) Total number of indeterminate results by protocol considering all data (strains and inoculated seeds); (B) Total number of indeterminate results by protocol considering only strains (i.e. no inoculated seed data); (C) PD rate mean values and standard deviation by protocol for DS1 dataset; (D) PD rate mean values and standard deviation by protocol for DS2 dataset. (E) ND rate mean values and standard deviation by protocol for DS1 dataset; (F) ND rate mean values and standard deviation by protocol for DS2 dataset. The x – axis in all graphs represents the nine protocols tested in this study, from p1 to p9. Please refer to Table 4 for details of each protocol. Different letters indicate values are significantly different, according to Fisher’s Exact Test, for count data with simulated P-values based on 1e + 05 replicates.

