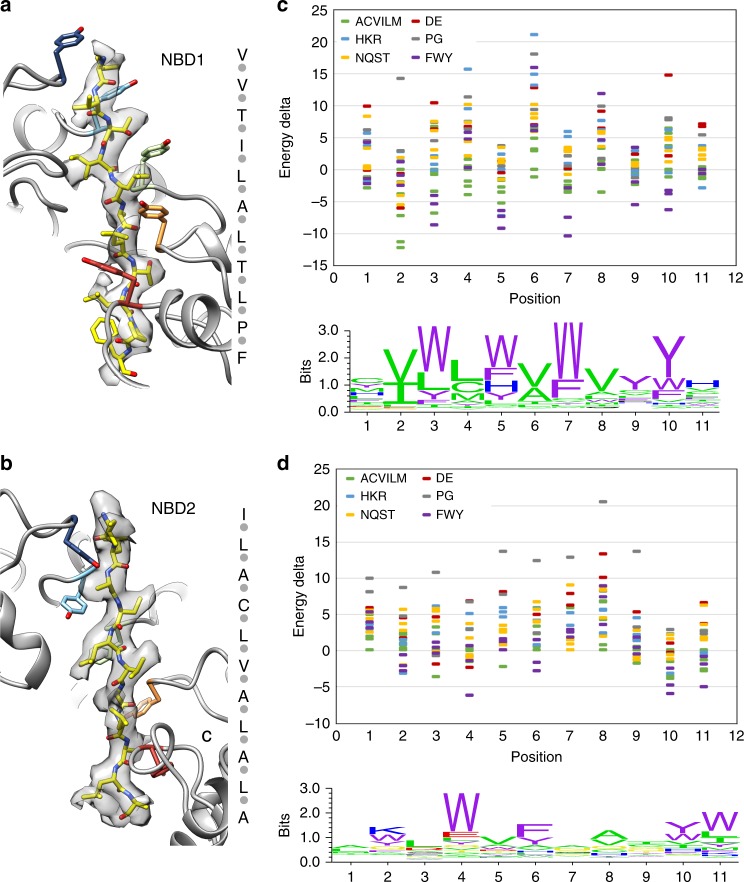
Fig. 4.
Analysis of the substrate sequence stabilized by the NBD1 and NBD2. Molecular model and sequence of the energetically favored casein peptide sequence (yellow) in density for the NBD1 (a) and NBD2 (b). Interacting Tyr resides (Y251 and Y653) are colored by protomer. A plot showing per-energy deviations at each of the 11 positions interacting with NBD1 (c) and NBD2 (d); the logo plots convert these energies to a distribution, showing the sequence preferences at each position

