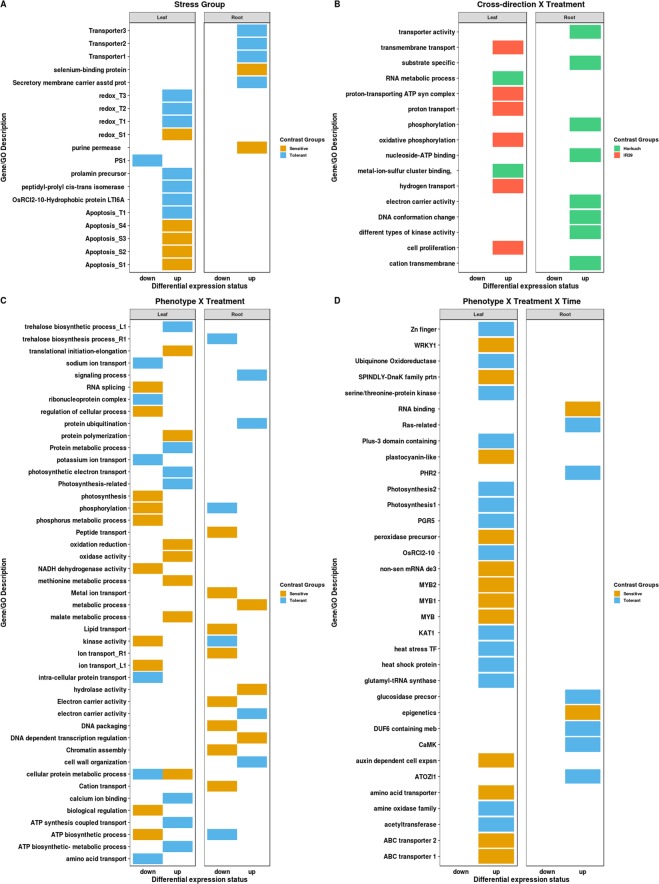
Figure 5.
A graphical representation of GO and important genes enrichments in main effects and contrasts from interacting factors. In fig. A–D, DEGs from stress group, cross-direction × treatment, stress group × treatment and stress group × treatment × time were shown as GO enrichment and gene annotation. GO/gene enrichment in contrasting stress groups is in fig. A. Fig. B Shows the enrichments of GO and genes for the cross-direction × treatment effect. Treatment × stress group interaction extracted GO/genes were plotted in fig. C. In the last part of the fig. D shows the differentially expressed genes and their associated GOs revealed from the composite experimental factor (stress group × treatment × time).

