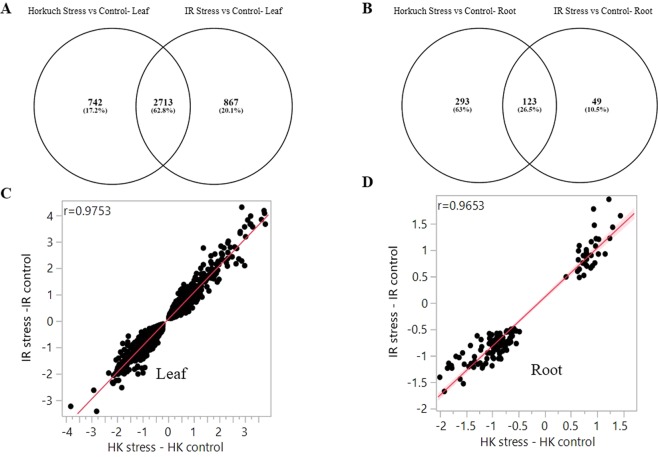
Figure 6.
Expression variation influenced by cytoplasmic background and common and unique differential gene counts. Fig. A & B Shows the expression variations in leaf and root tissues when they got compared by their cytoplasmic background. Similarities and differences of DEGs from two different cross directions plotted here in leaf and root separately. 62% of leaf DEGs were found common in leaf where only 26% were found common in root tissues. Fig. C & D Fold differences of the common genes from two cross directions were plotted here. In leaf tissue, correlation coefficients were 0.97 and in root it was 0.96.

