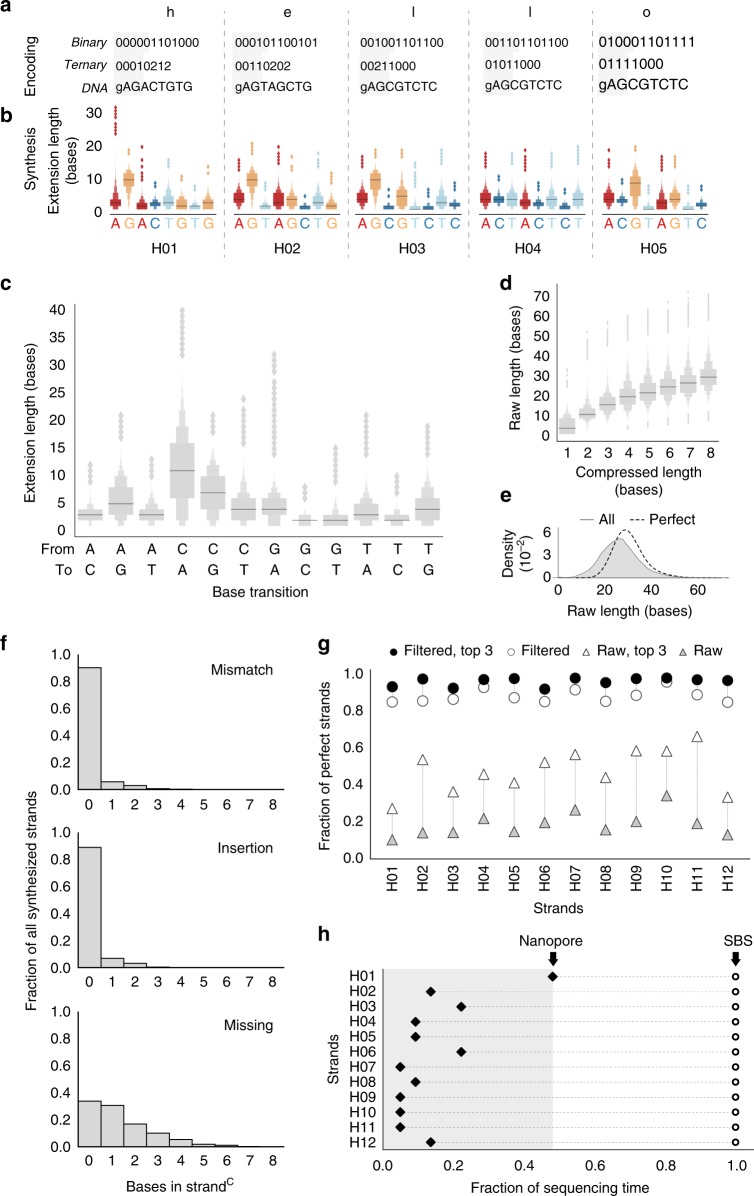
Fig. 2.
Demonstration of information storage in DNA using enzymatic synthesis. a The message “hello world!” was encoded in 12 template sequences, H01–H12, each representing one character. Transitions between nucleotides start with the last base of the initiator, which is labeled ‘g’. A header index (shaded gray) denotes strand order. Only results from H01–H05 are shown (see Supplementary Fig. 9). To encode each character, its respective ASCII decimal value, prefixed with an address is represented in base 2 (binary) or in base 3 (ternary) (see Supplementary Table 2), mapped to transitions (see Fig. 1c), resulting in template sequences with nucleotides to be synthesized (capitalized). b Extension lengths for each base from a is shown as a letter-value plot with median. Only perfect strandsR, those whose strandC is equivalent to a template sequence, are presented. Synthesis was performed with initiators tethered to beads and sequencing performed on the Illumina platform. c Distribution of extension lengths for each nucleotide transition, combined across all positions from all perfect strands is shown as a letter-value plot with median. d Stepwise increases in strandR length with an increasing strandC length for all synthesized strands of H01–H12 is shown as a letter-value plot with median. e Distribution of all strandR lengths. Distributions are derived via kernel density estimation for all synthesized strands (‘all’, gray shading) and a subpopulation of strands that contain all desired transitions (‘perfect’, dotted line). f Bulk error analysis for all synthesized strands of H01–H12. All strandsC were aligned, by Needleman–Wunsch, to their respective template sequences, and the number of mismatches, insertions, and missing nucleotides were tabulated. g Information retrieval with in silico filtering. Fraction of perfect strandsC is shown before (triangles) or after filtering (circles). Fraction of perfect strandsC is shown for all sequences (white) or only the top three most-abundant sequences (black). h Information retrieval by different sequencing platforms. Streaming nanopore sequencing (Oxford, filled diamonds) was compared with batch sequencing-by-synthesis (Illumina, open circles). Each dot indicates the fraction of sequencing run at which each strand is robustly retrieved (100% correct with 99.99% probability). Arrows denote the fraction of the sequencing run at which all data are robustly retrieved using each platform. Source data for b–h are provided in the Source Data file package

