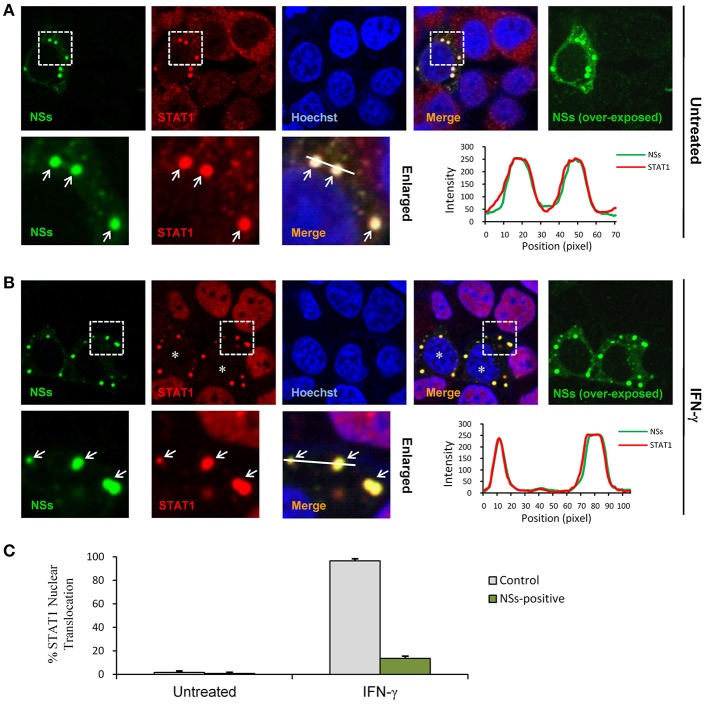
Figure 5.
NSs blocks IFN-γ-induced nuclear translocation of STAT1 by trapping STAT1 into IBs. (A,B) HEK293 cells transfected with the NSs expression plasmid were left untreated or treated with IFN-γ (as indicated) for 30 min at 48 h posttransfection and then fixed to visualize the expression and localization of NSs (green) and endogenous STAT1 (red) by IFA and confocal microscopy. Nuclei stained with Hoechst were shown in blue. Asterisks indicate the blockade of STAT1 nuclear accumulation in NSs-expressing cells. Arrows in the enlarged images of the dotted box areas show the sequestration of STAT1 into NSs IBs. An intensity line graph in the lower right corner of each panel shows the signal intensity of the green and red channels along the line in the enlarged merged images. To better visualize the NSs-positive cells, over-exposed images of the green/NSs channel were also presented. (C) Cells with or without NSs expression from the experiments of (A,B) were respectively scored for STAT1 nuclear translocation. Approximately 100 cells were counted for each group. Percentages of cells with noticeable STAT1 nuclear accumulation were shown, respectively.

