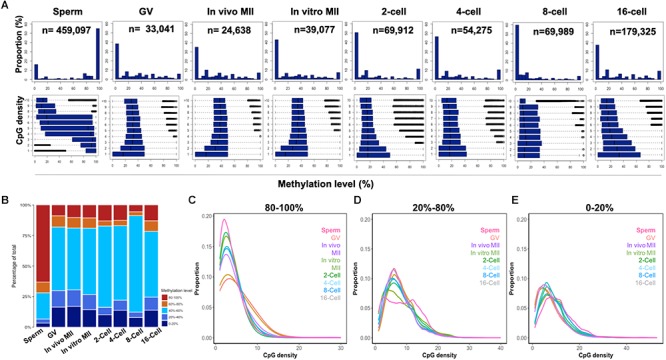
Figure 2.

CpG density and the methylome dynamics of bovine gametes and pre-implantation embryos. Histogram (A) of the percentages of 300-bp tiles with different DNA methylation levels at each development stage (upper panels). Box plots of methylation levels across different CpG densities at each stage (bottom panels). Stack bar plot (B) of the percentages of tiles with high (80–100%), intermediate (60–80%; 40–60%, and 20–40%), and low (0–20%) methylation levels. The distribution of high (C), intermediate (D), and low (E) methylation tiles against CpG densities at each stage. GV, germinal vesicle oocytes; MII, matured oocytes.
