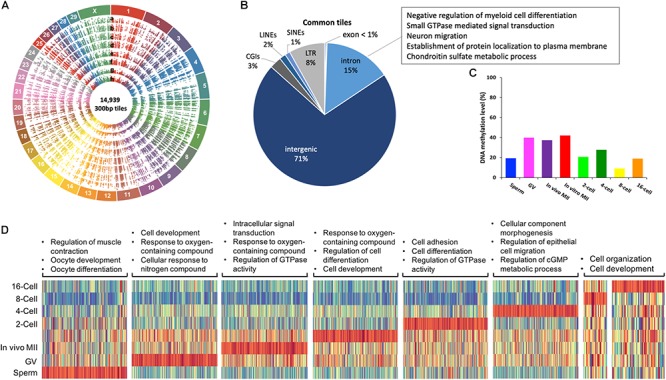
Figure 3.

Commonly methylated regions in bovine gametes and pre-implantation embryos. Circos plot (A) visualization of 14,939 commonly methylated 300-bp tiles among all samples. a. sperm, b. GV, c. in vivo MII, d. in vitro MII, e. 2-cell, f. 4-cell, g. 8-cell, h. 16-cell. Pie plot (B) of the distribution of commonly methylated tiles in genomic regions and their associated GO term representatives. Bar plot (C) of averaged DNA methylation levels of commonly methylated tiles across stages. Heatmap (D) of enrichment of hypermethylated regions in each stage and associated GO term representatives. GV: germinal vesicle oocytes; MII: matured oocytes. Green: hypomethylation, red: hypermethylation.
