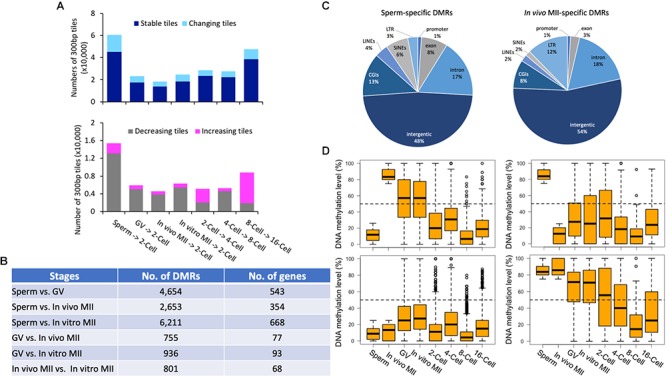
Figure 4.

Pairwise comparisons of methylomes between consecutive development stages and DMRs in gametes. Histogram (A) of the numbers of stable (dark blue) and changing (sky blue) tiles between consecutive stages. Histogram of the numbers of decreasing (gray) and increasing (pink) tiles between consecutive stages. The numbers (B) of DMRs and corresponding genes between gametes of different types. Pie plots (C) of the distribution of in vivo MII- and sperm-specific DMRs in annotated genomic regions. Box plots (D) of DNA methylation levels of oocyte- (upper left) or sperm- (upper right) specific DMRs in gametes and early embryos, as well as distributions of tiles hypomethylated (≤25%; bottom left) and hypermethylated (≥75%; bottom right) tiles in both gametes in each development stage. GV, germinal vesicle oocytes; MII, matured oocytes.
