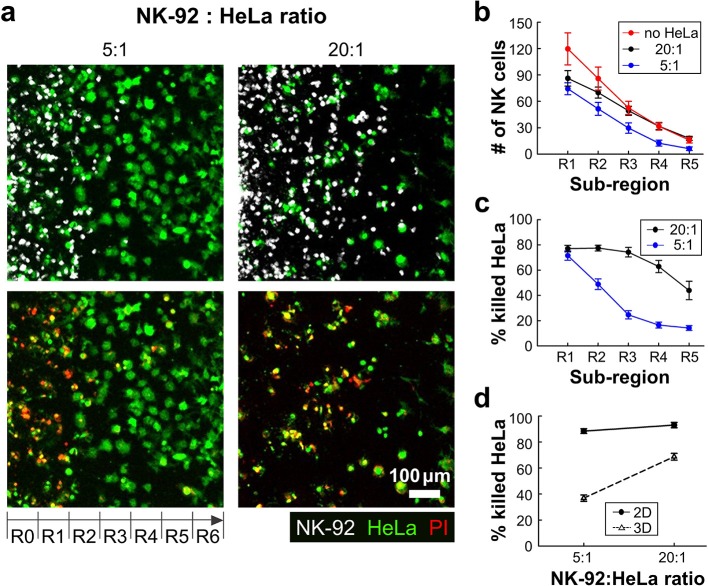
Figure 3.
3D ECM reduces cytotoxicity by limiting cancer cell accessibility. (a) Images taken after 24 h of interaction of NK cells and HeLa cells in two NK-92:HeLa ratios. HeLa cells (green) and NK-92 cells (white) are displayed in upper images and lower images show live/dead HeLa cells at the same moment with the upper images. (b) The numbers of NK cells within the ROI sub-regions in collagens without HeLa cells (no HeLa), with 20:1 and 5:1 of NK-92:HeLa ratios (n ≥ 12). (c) The percentage of killed HeLa cells within the ROI sub-regions in the two NK-92:HeLa ratios (n ≥ 18). (d) The percentage of killed HeLa cells within the whole ROI from R1 to R5 in the two NK-92:HeLa ratios. (n = 3 for 2D assay, n ≥ 18 for 3D assay). Dot plots in (b–d) show mean ± SEM.

