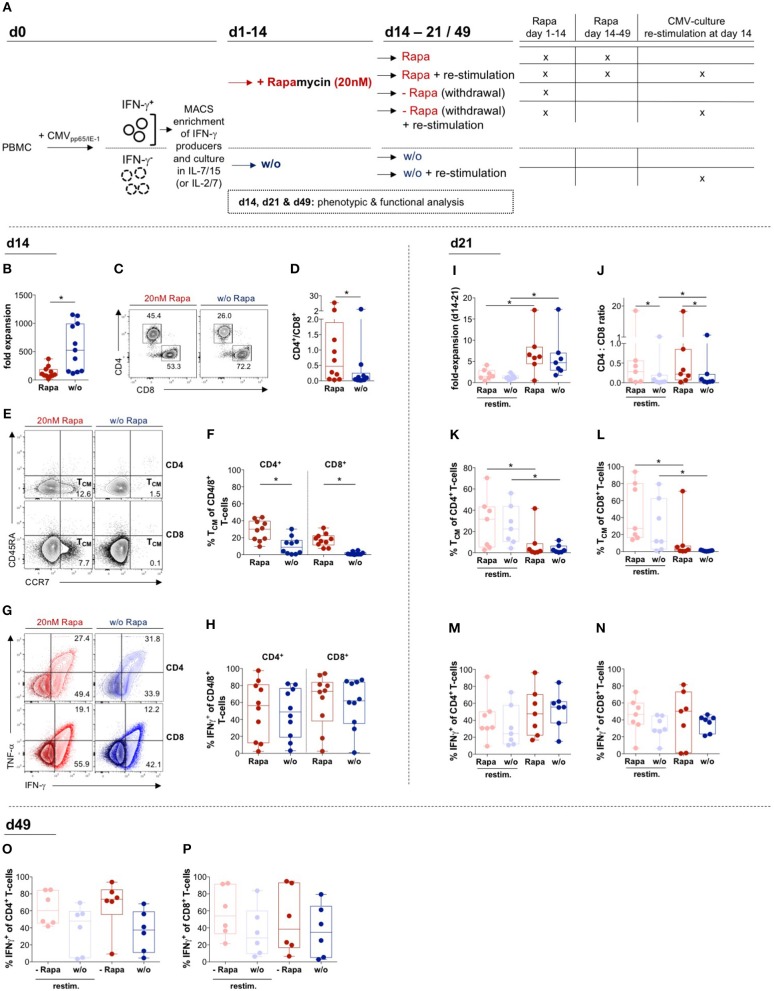
Figure 1.
Effects of Rapamycin on T-cell products: Expansion, phenotype and function. (A) Schematic overview of experiments: T-cell products (TCPs) were generated from PBMCs isolated from venous blood of healthy donors (HDs) by magnetically activated cell sorting (MACS) of T-cells producing IFNγ in response to stimulation with CMVIE−1/pp65 peptide pools and expanded in the presence of either IL-2/IL-7 (Figure S1) or IL-7/IL-15 without (w/o; blue) or with addition of 20 nMof Rapamycin (Rapa; red) (B–P). Parts of the culture were re-stimulated using thawed CD3− PBMCs loaded with CMVIE−1/pp65 peptide pools, deprived of Rapamycin or a combination of both on d14. (B) Expansion rates of IL-7/15-expanded Rapa-treated (Rapa-)TCPs (red) and untreated TCPs (blue) of n = 10 healthy donors (HDs) calculated from yield at d14 divided by the number of seeded cells at d0. We gated flow cytometric data on lymphocytes singlets living CD3+ T-cells. (C) Exemplary flow cytometry plots of CD4+ and CD8+ populations among living CD3+ T-cells in the Rapa-TCP (left plot) and untreated TCP (w/o, right plot) of one HD. (D) CD4/CD8 ratios in Rapa- (red) and untreated TCPs (blue) of n = 10 HDs calculated from flow cytometry data as presented in (C). (E) Gating strategy for CD45RA− CCR7+ central memory T-cells (TCM) among CD4+ (upper panel) and CD8+ (lower panel) in Rapa- (left panel) and untreated TCPs (right panel) of one exemplary HD. (F) Proportions of CD4+ and CD8+ TCM among Rapa- (red) and untreated TCPs (blue) of n = 10 HDs determined from flow cytometric data as shown in (E) at d14. (G,H) To detect CMV-specific cytokine producers, TCPs were stimulated with CMVIE−1/pp65 peptide-loaded autologous lymphoblastic cell lines (LCLs) at a ratio of 1:10 for 6 h and Brefeldin A (BFA) was added after 1 h. (G) Representative flow cytometric plots of IFNγ- and TNFα-producers in Rapa- (left panel, red) and untreated TCPs (right panel, blue) of one HD. The dark population represents unstimulated and the light population illustrates CMVIE−1/pp65-stimulated CD4+ (upper panel) and CD8+ T-cells (lower panel). (H) Proportions of CMV-specific IFNγ-producers among CD4+ and CD8+ T-cells in Rapa- (red) and untreated TCPs (blue) of n = 10 HDs determined from flow cytometric data as shown in (G) at d14. (I–N): For re-stimulation on d14 of culture, thawed CD3− autologous PBMCs were loaded with CMVIE−1/pp65 peptide pools and added at 1:5 ratio to T-cells. (I) Expansion rates of IL-7/15-expanded re-stimulated (pastel colors) or non-re-stimulated (dark colors) Rapa- (red) and untreated TCPs (blue) of n = 7 HDs calculated from yield at d21 divided by the number of cells at d14. (J) CD4/CD8 ratios in Rapa- (red) and untreated TCPs (blue) of n = 7 HDs calculated from flow cytometric data as presented in (C) at d21. (K,L): Proportions of CD4+ (K) and CD8+ TCM (L) among Rapa- (red) and untreated TCPs (blue) of n = 7 HDs determined from flow cytometric data as shown in (E) at d21. (M–P) To detect CMV-specific cytokine producers, TCPs were stimulated with CMVIE−1/pp65 peptide-loaded autologous LCLs for 6 h and BFA was added after 1 h. (M–N) Proportions of CMV-specific IFNγ-producers among CD4+ (M) and CD8+ T-cells (N) in Rapa- (red) and untreated TCPs (blue) of n = 7 HDs determined from flow cytometric data as shown in (G) at d21. (O,P) To mimic the situation after infusion, Rapa was withdrawn and TCPs were cultivated long-term until d49. Proportions of CMV-specific IFNγ-producers among CD4+ (O) and CD8+ T-cells (P) in TCPs withdrawn from Rapa (red) and untreated TCPs (blue) of n = 6 HDs determined from flow cytometric data as shown in (G) at d49. For all graphs normal distribution of data points was tested with Kolmogorov-Smirnov test and paired t-test was used to determine significance in normally distributed samples or Wilcoxon's matched-pairs signed rank test in not normally distributed samples, respectively. P-values below 0.05 are indicated by * and defined to be significant.

