Figure 2.
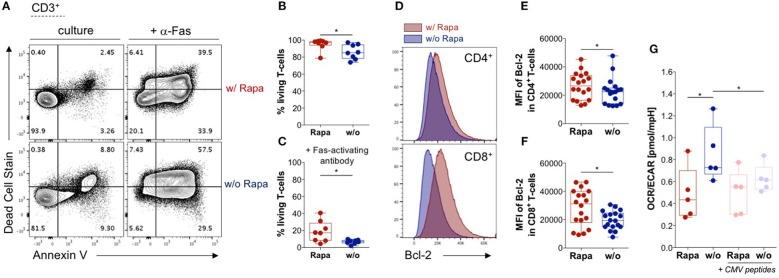
Rapamycin promotes survival of T-cells and stabilizes their metabolism. (A) Exemplary dot-plots of flow cytometry data regarding live/dead stain and Annexin V stain (apoptosis) gated on lymphocytes singlets CD3+ T-cells. Living T-cells are defined by double negative staining for Annexin V and live/dead stain in Rapa- (upper panel) and untreated TCPs (lower panel). Samples in the right panel were treated with 1 μg/ml activating antibody against Fas (CD95) to induce apoptosis. (B) Proportions of living T-cells in Rapa- (red) and untreated TCPs (blue) of n = 8 HDs identified as shown in (A) at d21. (C) Proportions of living T-cells in Rapa- (red) and untreated TCPs (blue) of n = 8 HDs incubated with Fas-activating antibody identified as shown in (A) at d21. (D) Exemplary histograms of fluorescence intensity of Bcl-2 in CD4+ (upper panel) and CD8+ T-cells (lower panel) of untreated (blue) and Rapa-TCPs (red) acquired by flow cytometry. (E,F) MFIs of Bcl-2 in CD4+ (E) and CD8+ T-cells (F) in untreated (blue) and Rapa-TCPs (red) of n = 18 HDs. (G) Oxygen consumption rare (OCR)/extracellular acidification rate (ECAR) ratio of Rapa- (red) and untreated TCPs (blue) of n = 5 HDs determined in a Seahorse assay. For stimulation (pastel colors) CMVIE−1/pp65 peptide pools were added to TCPs relying on mutual presentation of peptides by T-cells from the TCP. For all graphs normal distribution of data points was tested with Kolmogorov-Smirnov test and paired t-test was used to determine significance. P-values below 0.05 are indicated by * and defined to be significant.

