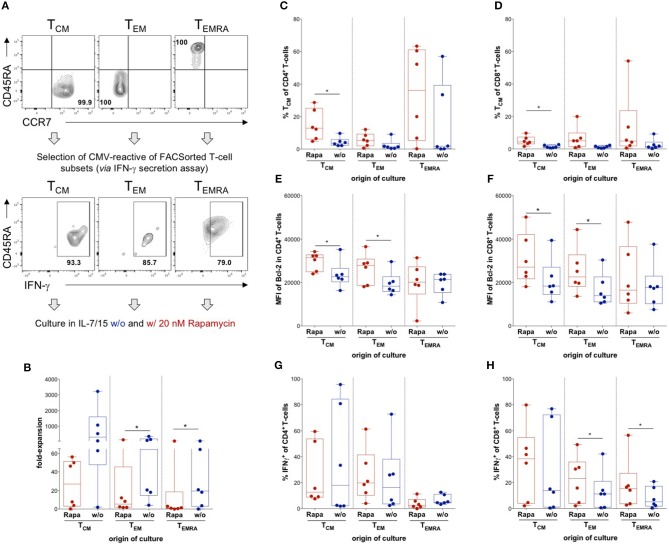
Figure 3.
Influence of Rapamycin on different T-cell memory subsets. (A) Schematic experimental setup: TCM, TEM, and TEMRA were sorted out of lymphocytes singlets CD3+ T-cells according to expression of CCR7 and CD45RA, CMV-reactive T-cells were isolated from each subset using an IFNγ secretion assay and CMV-reactive T-cells from each subset were cultured with (Rapa) and without Rapamycin (w/o). Exemplary dot plots of flow cytometry data of sorted subsets of one HD and respective positive fractions of the IFNγ secretion assay are shown. (B) Expansion rates of the indicated subsets in the presence of (red, Rapa) and absence of Rapamycin (blue, w/o) calculated from total cell numbers at d21 divided by the seeded cell number. (C,D) Proportions of CD4+ (C) and CD8+ CD45RA− CCR7+ TCM-like cells (D) among Rapa-treated (red) and untreated (blue) cultures of indicated subsets determined from flow cytometric data at d21. (E,F) MFIs of Bcl-2 in CD4+ (E) and CD8+ T-cells (F) in untreated (blue) and Rapa-treated cultures (red) of isolated T-cell subsets determined in flow cytometry. (G,H) To detect CMV-specific cytokine production, cultures were stimulated with CMVIE−1/pp65 peptide-loaded autologous LCLs at a ratio of 1:10 for 6 h and BFA was added after 1 h. Proportions of CMV-specific IFNγ-producers among CD4+ (G) and CD8+ T-cells (H) in Rapa-treated (red) and untreated (blue) cultures of isolated T-cell subsets determined from flow cytometric data. All graphs contain data from n = 6 HDs, normal distribution of data points was tested with Kolmogorov-Smirnov test and paired t-test was used to determine significance in normally distributed samples or Wilcoxon's matched-pairs signed rank test in not normally distributed samples, respectively. P-values below 0.05 are indicated by * and defined to be significant.

