Figure 4.
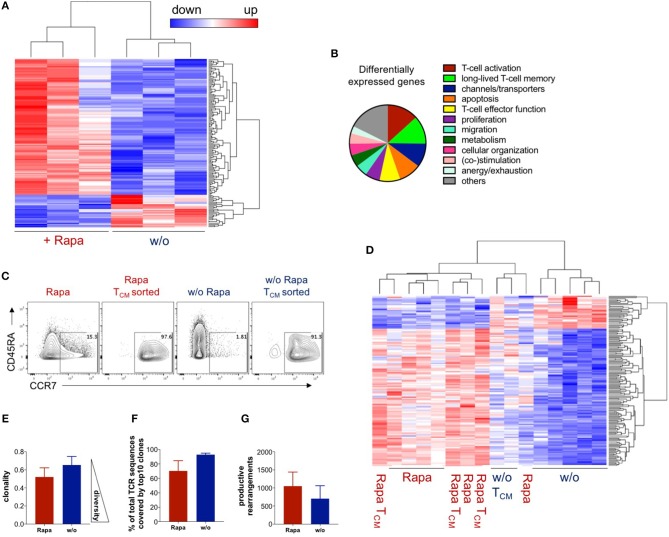
Rapamycin-treated TCPs have a unique transcriptome resembling TCM and are clonally more diverse. RNA expression data were acquired by RNA sequencing and samples had to pass a quality control to be included in the analysis. (A) Expression heat map of differentially expressed genes between untreated and Rapa-TCPs generated from fresh blood of n = 3 HDs at d21. (B) Processes allocated to the differentially expressed genes based on the literature (see Table S1 for details). (C) Exemplary dot plots of CCR7/CD45RA expression of untreated and Rapa-TCPs and the respective TCM-like cells sorted on d18 of culture. (D) Expression of differentially expressed genes between Rapa- and untreated TCPs from fresh blood of n = 3 HDs at d21, buffy coats of n = 3 HDs at d18 and TCM sorted from Rapa- and untreated TCPs generated from buffy coats of the same n = 3 HDs at d18 including clustering. Samples not included in the graph were discarded due to failure at the quality threshold. (E) Clonality of Rapa- (red) and untreated TCPs (blue) n = 3. (F) Proportions of represented sequences covered by the top 10 most represented clones in Rapa- (red) and untreated TCPs (blue), n = 3 HDs. (G) Numbers of productive rearrangements included in in Rapa- (red) and untreated TCPs (blue), n = 3 HDs. Data in (E,F) were calculated with ImmunoSEQ-Analyzer3.0 software based on TCRβ sequencing.

