Figure 5.
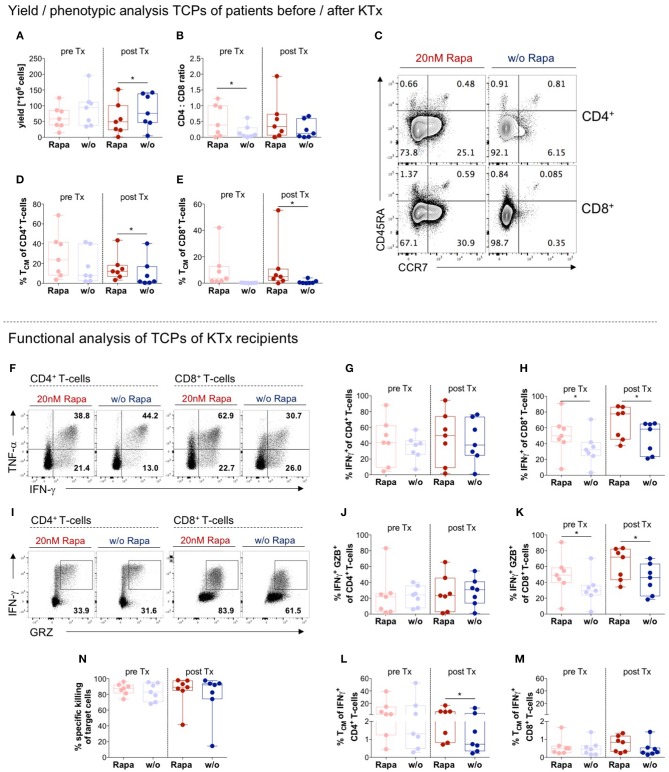
Manufacture of Rapa-TCPs is feasible before/after transplantation. N = 7 paired samples of untreated (w/o, blue) and Rapa-TCPs (red) from the same patients before (pre; pastel colors) and a few weeks after KTx (post). (A) Yield of TCPs = total cell number derived from 20 ml of patient blood on d21. (B) CD4/CD8 ratio of TCPs determined by multicolor flow cytometry on d14. (C) Exemplary dot plots of one patient's untreated (right) and Rapa-TCPs (left) comparing subset distributions of CD3+CD4+ (upper panel) and CD3+CD8+ (lower panel) T-cells according to CCR7 and CD45RA expression on d14. (D,E) Proportions of CD45RA− CCR7 + TCM among CD4+ (D) and CD8+ T-cells (E) in TCPs on d14 as determined per gating strategy shown in (C). (F) Exemplary dot plots of one patient comparing CD3+CD4+ (left panel) and CD3+CD8+(right panel) IFNγ- and TNFα-producers in Rapa- (red) and untreated TCPs (blue) detected by intracellular staining in multicolor flow cytometry after 6 h stimulation with autologous LCLs loaded with CMVIE−1/pp65 peptide pools (gray) or incubation with unloaded autologous LCLs as control (black) and addition of BFA after 1 h on d21. (G,H) Summary of background subtracted proportions of CD4+ (G) and CD8+ (H) CMV-reactive IFNγ-producing T-cells in Rapa- (red) and untreated TCPs (blue) gated as illustrated in (F). (I) Exemplary dot plots of one donor comparing CD4+ (left panel) and CD8+ (right panel) CMV-reactive IFNγ- and GZB-producers in Rapa- (red) and untreated TCPs (blue) detected by intracellular staining in multicolor flow cytometry after 6 h stimulation with autologous LCLs loaded CMVIE−1 and CMVpp65 peptide pools (gray), incubation with unloaded autologous LCLs as control (black) and addition of BFA after 1 h on d21. (J,K) Summary of background subtracted proportions of CD4+ (J) and CD8+ (K) CMV-reactive IFNγ/GZB-double-producers in Rapa- (red) and untreated TCPs (blue) gated as illustrated in (I). (L,M) Proportions of CD45RA− CCR7 + TCM among CMV-reactive IFNγ-producing CD4+ (L) and CD8+ T-cells (M). Gates were applied from gates set for global T-cell subset distribution (see Figure S4). (N) Specific killing of CMVIE−1/pp65 peptide pool loaded autologous LCLs determined by ratio with unloaded allogenic LCLs at a 1:10 ratio with TCPs after incubation overnight. All data tested for normal distribution of data points with Kolmogorov-Smirnov test; significance determined with paired t-test if normally distributed or Wilcoxon's matched-pairs signed rank test for not normally distributed samples. P-values below 0.05 are indicated by * and defined to be significant.

