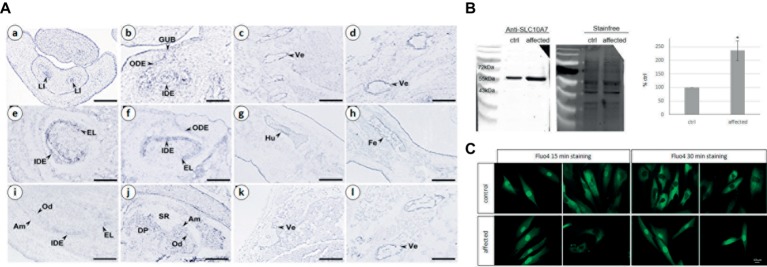
Figure 3.
(A) Analysis of mouse Slc10a7 transcripts distribution by in situ hybridization. Sections illustrate Slc10a7 expression in the developing bone, vertebrae, molars, and incisors. Developmental stages and section planes are: E14.5 frontal (a,b), E16.5 sagittal (c–h); E18.5 sagittal (i–l) sections. Am, ameloblasts; DP, dental papila; EL, epithelial loop; GUB, gubernaculum; IDE, inner dental epithelium; LI, lower incisor; Od, odontoblasts; ODE, outer dental epithelium; SR, stellate reticulum; Ve, vertebrae. Scale bars: 10 μm (b); 40 μm (a,c,g,h); 30 μm (d,l); 60 μm (i,j); 80 μm (e,f); 150 μm (k). (B) SLC10A7 expression in control and patient skin fibroblasts as detected by western blot. The stain-free membrane, displaying the total amount of protein loaded, was used for quantification. The western blot shown corresponds to one significant experiment (n = 3). The data plotted were the mean of three independent experiments. Statistical analysis was done with the t-test and the p was determined *p < 0.05. (C) Calcium localization in control and patient fibroblasts. The cells were stained for 15 min or 30 min with 4 μm of Fluo4, then washed for 15 or 30 min, respectively and observed by fluorescent microscopy. Images were taken with a 400× magnification, scale bar 10 μm.

