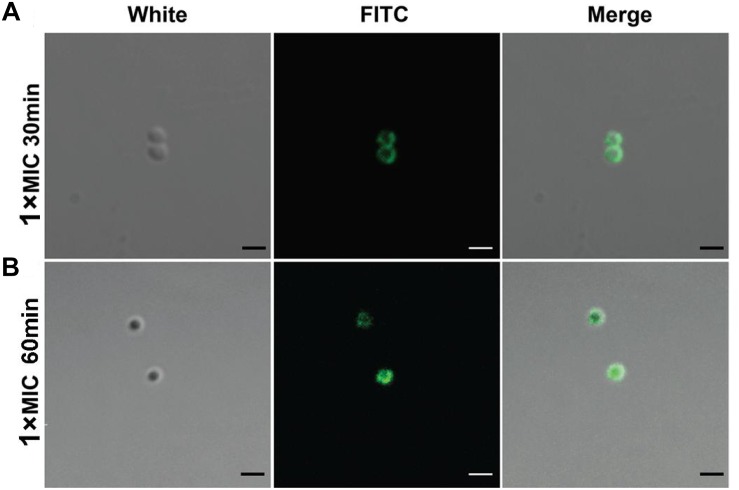
FIGURE 2.
Confocal microscopic imaging shows DP7 aggregation on the cell surface and entry into cells. Confocal microscopic images of S. aureus ATCC 25923 after treatment with FITC-DP7 at 1× MIC for (A) 30 and (B) 60 min. The increasing fluorescence intensity from 30 to 60 min after treatment with the DP7 peptide may indicate progressive membrane damage and pore formation in S. aureus ATCC 25923, allowing increased uptake of the fluorescent probe. The scale bar in this figure is 1 μm.

