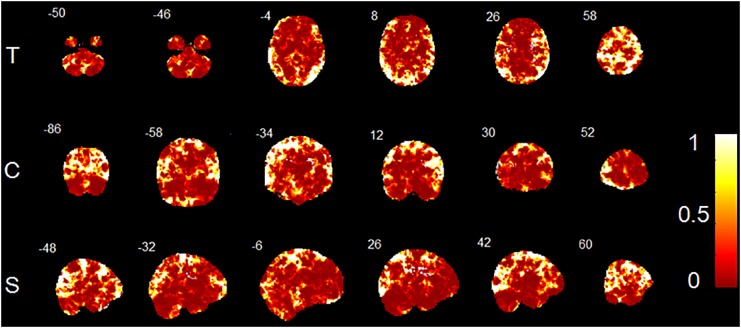
FIGURE 3.
P-value map converted from accuracy map. T, transverse direction; C, coronal direction; S, sagittal direction. The color-bar indicates the p-values of the whole brain GM voxels. The image is displayed in the neurologic convention, with the left side corresponding to the left-brain hemisphere.

