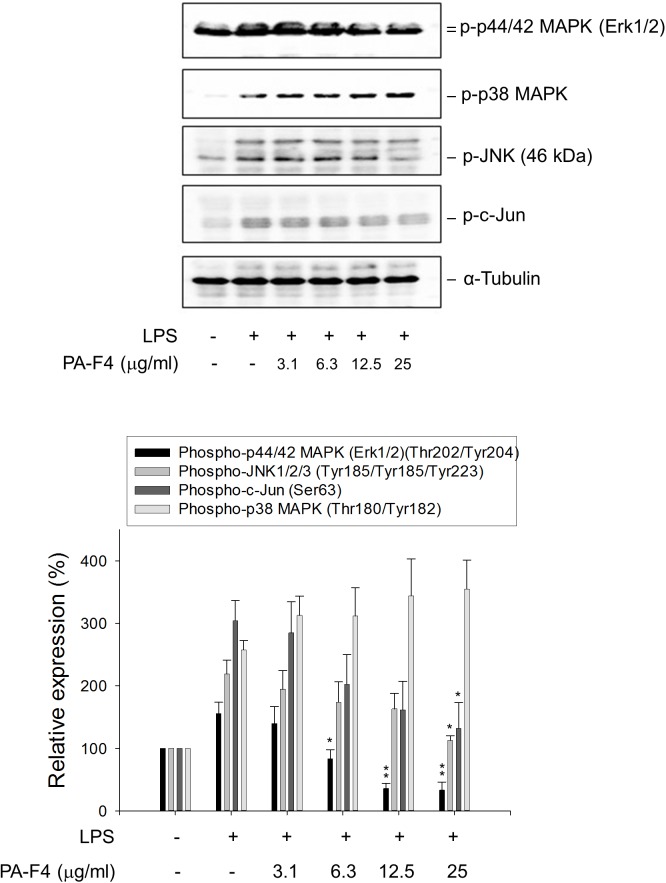
FIGURE 3.
Effect of PA-F4 on LPS-induced MAPK phosphorylation. THP-1 cells were seeded and differentiated by 50 nM PMA. After 48 h, the cells were pre-treated in the absence or presence of the indicated agent for 0.5 h and then co-treated with 1 μg/ml LPS for 2 h. The cells were harvested for the detection of the indicated protein expression using Western blot analysis. Data are expressed as mean ± SEM of three to five independent determinations. One-way ANOVA by Newman–Keuls post hoc test is used. ∗P < 0.05, ∗∗P < 0.01 compared with LPS control. The analysis of P (ANOVA) indicates the following: for phospho-p44/42 MAPK group, P < 0.001; for phospho-JNK1/2/3 group, P = 0.008; for phospho-c-Jun group, P = 0.010; for phospho-p38 MAPK group, P = 0.005.

