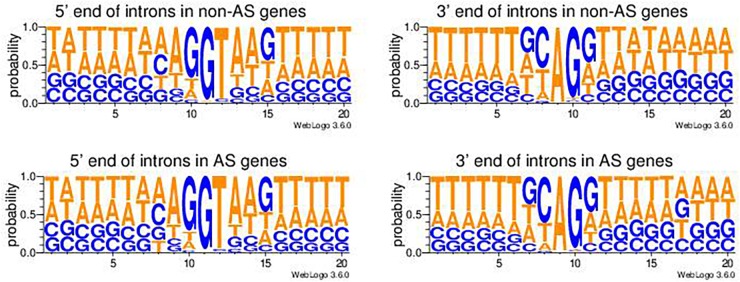
FIGURE 3.
Pictograms of nucleotide probabilities at each position of the exon-intron junctions in genes not undergoing alternative splicing (non-AS genes) and genes undergoing alternative splicing (AS genes). The 5′-end intronic nucleotides are from position 11 to 20 in the left panel pictograms and the 3′-end intronic nucleotides are from position 1 to 10 in the right panel pictorgrams.

