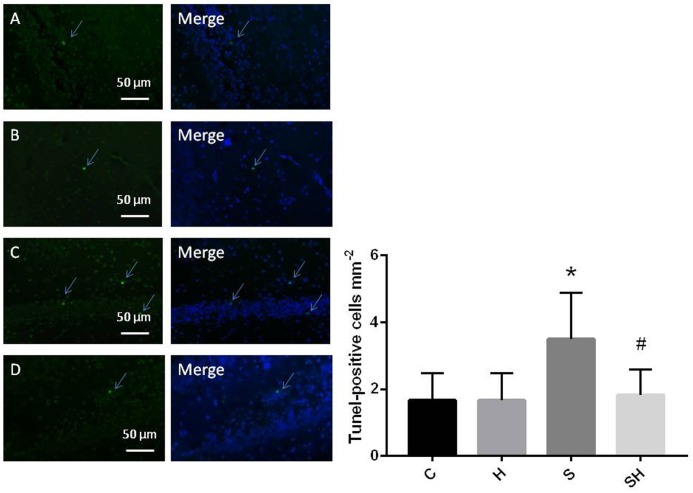
FIGURE 2.
Quantification and detection of TUNEL-positive cells in the hippocampal CA1 region of the neonatal rat brain 18 h after anesthesia Coronal slices for representative TUNEL staining in control (A), H (B), S (C), and SH groups (D). (×400 magnification) (∗P< 0.05 vs. group C, #P< 0.05 vs. group S, n = 6/group). Scale bar = 50 μm.

