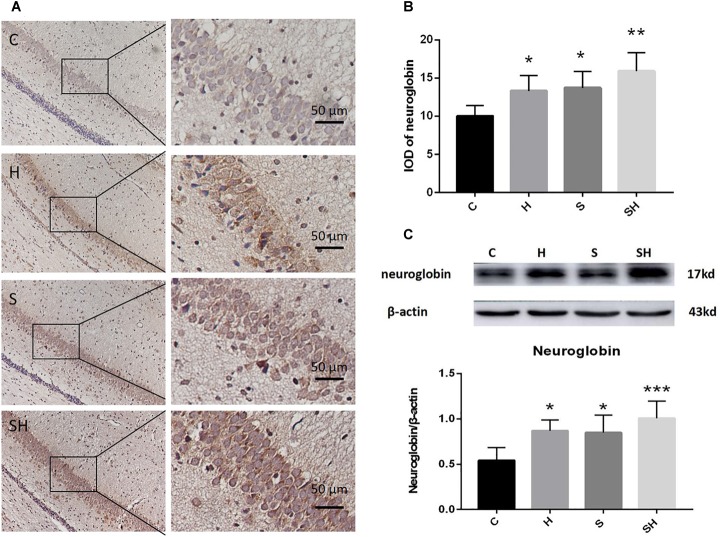
FIGURE 4.
Hemin increases the expression of Ngb. (A) Immunohistochemistry of neuroglobin in the neonatal hippocampal CA1 region in each group. Scale bar = 50 μm. (B) Integrated optical density of neuroglobin in the neonatal rat hippocampus. (∗P< 0.05 vs. group C, ∗∗P< 0.01 vs. group C, n = 6/group). (C) Expression and representative image of neuroglobin in the neonatal hippocampus 18 h after sevoflurane exposure. (∗P< 0.05 vs. group C, ∗∗∗P< 0.001 vs. group C, n = 6/group).

