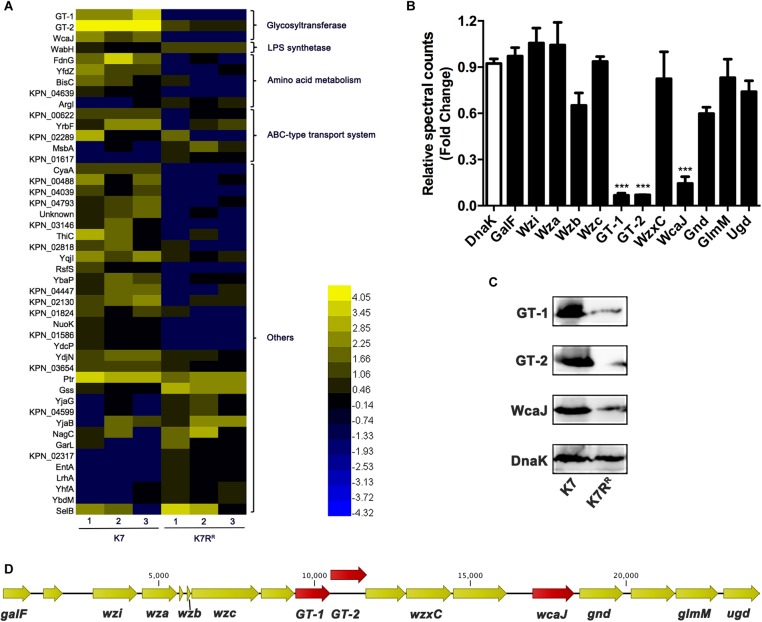
FIGURE 3.
The differentially expressed proteins between K. pneumoniae K7 and K7RR. (A) Heat-map analysis of differentially expressed proteins between K. pneumoniae K7 and K7RR. The heat-map was generated by Heml 1.0. Lanes 1–3 represent three biological replicates at each sampling time. Protein functional classification was performed by STRING, version 10.5. (B) Spectral count fold changes. The relative spectral counts of proteins encoded by cps gene cluster between K. pneumoniae K7 and K7RR were analyzed. DnaK served as a loading control. Relative spectral count fold changes = (spectral counts of K7RR)/(spectral counts of K7). ∗∗∗represents significant differences at P < 0.001. Data represent the mean ± SEM of triplicate biological experiments at each sampling time. (C) Western blot analyses of GT-1, GT-2, and WcaJ. Expression levels of GT-1, GT-2, and WcaJ in K. pneumoniae K7 and K7RR were detected. Expression of DnaK was detected as a control. (D) Schematic of cps gene cluster of K. pneumoniae K7 indicated by arrows with different colors. The arrow represents the direction of transcription.

