FIGURE 7.
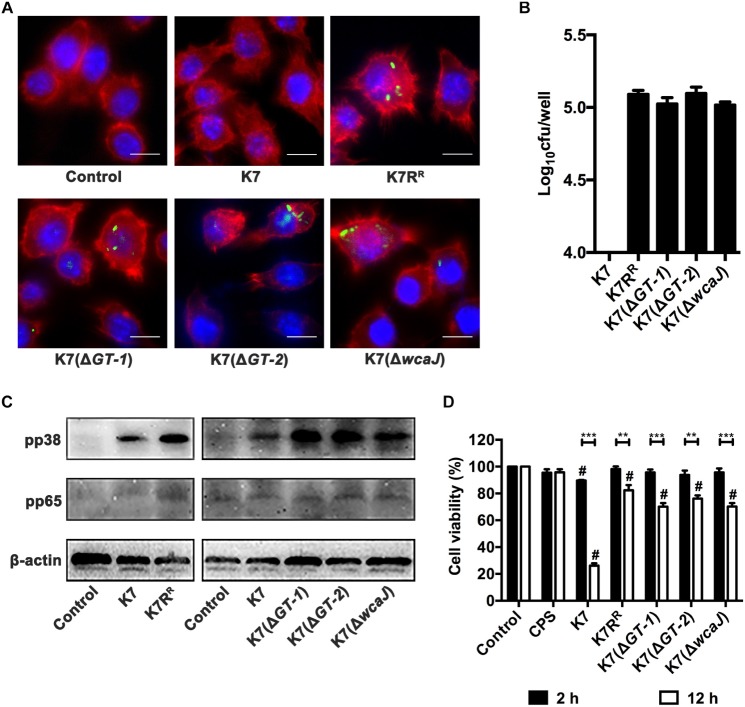
Endocytosis, activation and cytotoxicity of RAW264.7 cells after incubation with different K. pneumoniae strains. (A) Immunofluorescence analysis of endocytosis effects of RAW264.7 cells after incubation with different K. pneumoniae strains. K. pneumoniae K7, K7RR, K7(ΔGT-1), K7(ΔGT-2), and K7(ΔwcaJ) were stained with SYTOTM 9 Green Fluorescent Nucleic Acid Stain. The K. pneumoniae strains were then co-incubated with RAW264.7 cells in antibiotic-free supernatants. Cytoskeleton and nuclei were stained with Phalloidin-iFluor 555 and Hoechst 33342, respectively. The endocytosis of these K. pneumoniae strains in RAW264.7 cells was determined with a laser scanning confocal microscope and then observed at a magnification 1000× (scale bar, 10 μm. Images shown are representative of three independent experiments). (B) The bacterial loads of intracellular K. pneumoniae in RAW264.7 cells. Cells (5 × 10⁵) were incubated with K7, K7RR, K7(ΔGT-1), K7(ΔGT-2), and K7(ΔwcaJ) at 37°C for 2 h. After gentamicin treatment and cell lysis, bacterial loads in each cell samples were determined by plating. Data represent the mean ± SEM of triplicate experiments. (C) Expression levels of pp38 and pp65 in RAW264.7 cells after incubation with K. pneumoniae K7, K7RR, K7(ΔGT-1), K7(ΔGT-2), and K7(ΔwcaJ). Untreated cells were used as controls. β-actin served as a loading control. (D) Cytotoxicity analysis of RAW264.7 cells after incubation with purified CPS from K7 (10 μg) or different K. pneumoniae for 2 or 12 h. Cells without any treatment were served as controls and their viability was set as 100%. The statistical differences between different treatment groups and control group were labled with # (P < 0.05); the statistical differences of the same treatment groups at different time periods (2 or 12 h) were labled with ∗∗ (P < 0.01), and ∗∗∗ (P < 0.001). Data represent the mean ± SEM of triplicate experiments.

