Figure 1.
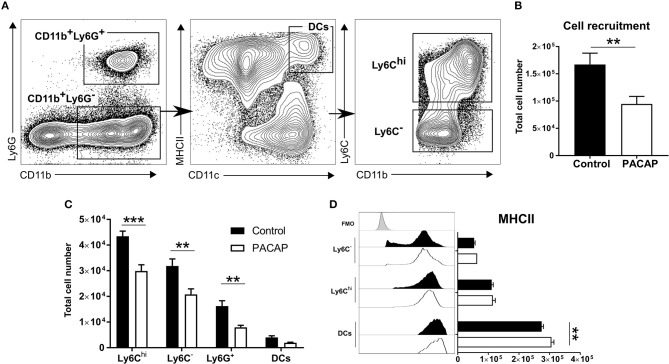
Immune cell recruitment and activation upon PACAP administration. Peritoneal cells of acutely-infected mice were analyzed by flow cytometry. Cells were selected based on the forward-scatter/side-scatter plot (FSS/SSC) and living, single cells were chosen for further analysis (not shown). (A) Gating strategy used to discriminate CD11b+Ly6G+ neutrophils and CD11b+Ly6G− monocyte-derived cells. CD11b+Ly6G− monocyte-derived cells were further divided into CD11chiMHCIIhi DCs and then differentiated according to Ly6C expression: Ly6Chi inflammatory monocytes and Ly6C− peritoneal macrophages. (B) Shows the total recruitment of living single cells. (C) Bar charts show cell recruitment of the identified cell populations in peritoneal cavity exudate of control and PACAP-treated groups (control: black bars; PACAP-treated: white bars). (D) Histograms and bar charts show expression of the activation marker MHCII on peritoneal cell subsets according to median fluorescence intensity (MFI). Control (black bars/histogram) and PACAP-treated (white bars/histogram); FMO (gray histogram) data are expressed as mean ± SEM, **p < 0.01, ***p < 0.001 (two-tailed unpaired t-test).

