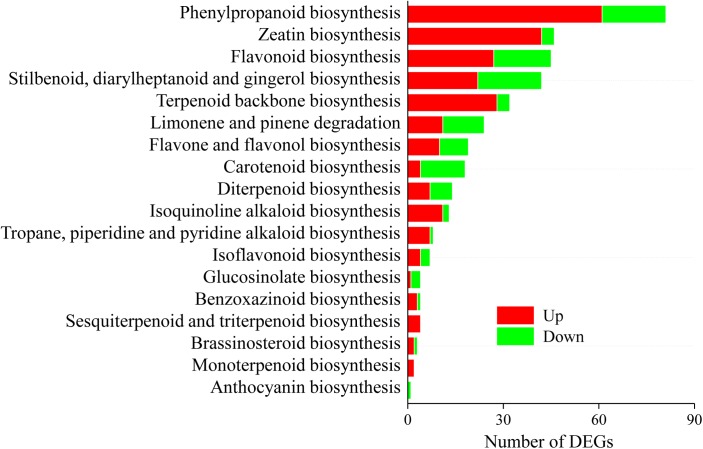
FIGURE 4.
Distribution of differentially expression genes involved in secondary metabolism in shoots of A. lancea after the fungal endophyte Gilmaniella sp. AL12 inoculation. The x axis indicates the KEGG pathway. The y axis presents the number of DEGs. Numbers in red block or green blocks represent the number of upregulated or downregulated DEGs, respectively.

