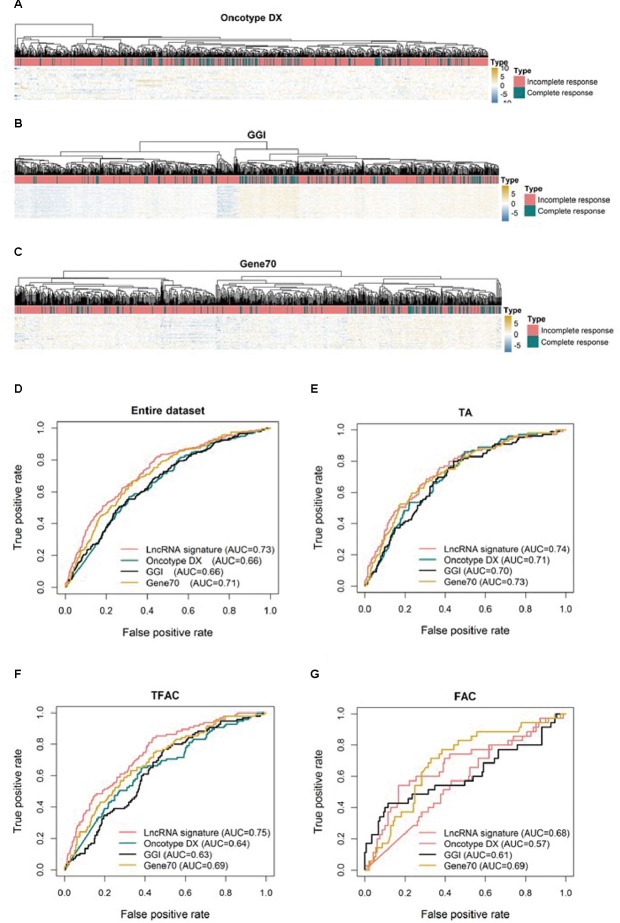
FIGURE 3.
Unsupervised clustering heatmaps and ROC curves for publically available signatures. Heatmaps based on genes (rows) of patients with breast cancer (columns) for the Oncotype DX (A), GGI (B), and Gene70 (C) signatures. Red and blue indicate high and low expression, respectively. ROC curves assess the accuracy of the three-lncRNA, Oncotype DX, GGI and Gene70 signatures for all patients (D), patients treated with TA (E, taxane and anthracycline), TFAC (F, taxane, 5-fluorouracil, anthracycline, and cytoxan) and FAC (G, 5-fluorouracil, anthracycline, and cytoxan). True positive rate represents module sensitivity, whereas false positive rate is one minus the specificity.

