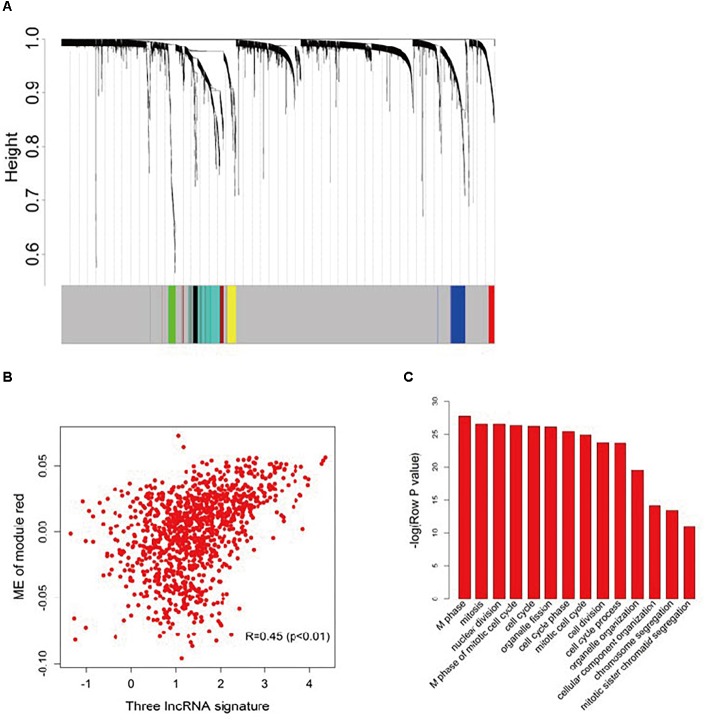
FIGURE 4.
Functional annotation of the three lncRNA signatures. (A) Hierarchical cluster analysis dendrogram was utilized to identify co-expression clusters with the gene profiler from the dataset with 1,102 patients with breast cancer treated with chemotherapy. In the picture, branches are presented as the co-expression modules with highly interconnected genes with different colors to indicate module assignment. (B) Scatter plot between the three-lncRNA signature and ME of module red. Significant positive correlation relationship between them (R = 0.45). (C) GO enrichment analysis for the 45 genes comprising the red modules presented multiple processes. The original significance reported by DAVID for GO biological processes were transformed to “–log (p-value)” for plotting.

