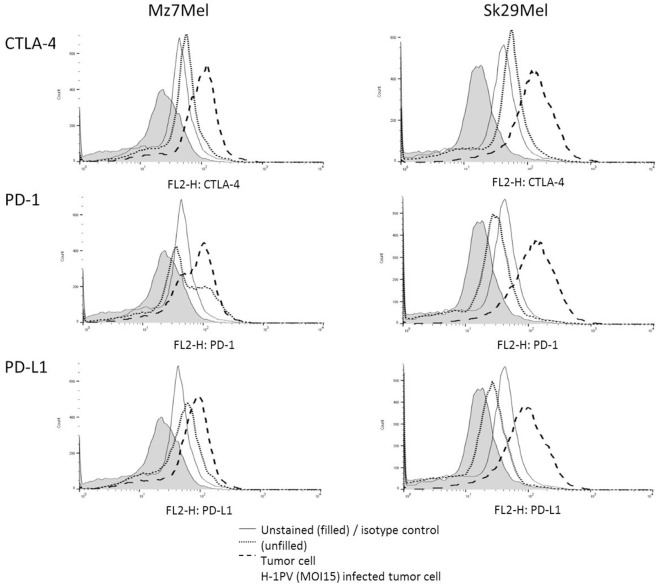
Figure 1.
Expression of CTLA-4, PD-1, and PD-L1 on the surface of the melanoma cells Sk29Mel-1 and Mz7Mel after H-1PV infection using FACS analysis (n = 3). Histogram blots are illustrated in an example manner. Experiments were performed independently as triplicate. FACS, fluorescence-activated cell sorting.

