
Figure 3.
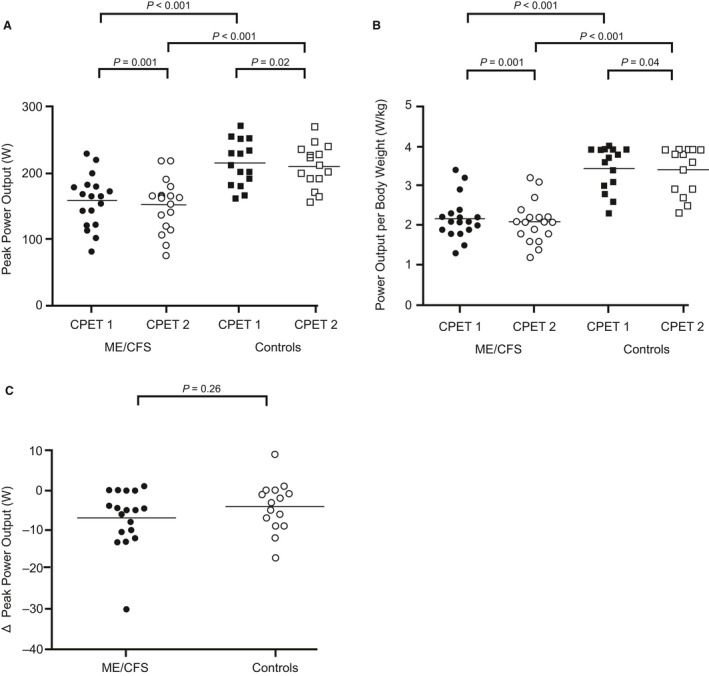
Power output at peak exercise. Data points represent individual measures for each participant and horizontal lines are mean values. (A) shows peak power output for both CPET1 and CPET2 and for both study groups, (B) shows peak power output adjusted for body weight, and (C) shows the difference (Δ) in peak power output between CPET1 and CPET2 for both study groups.