
Figure 6.
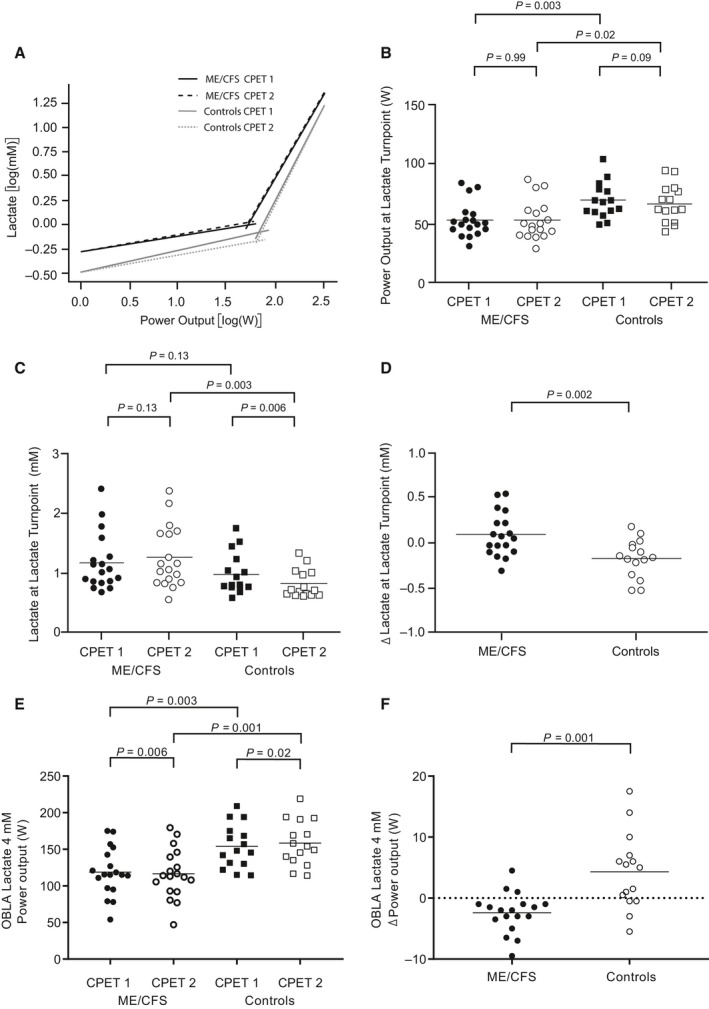
Power output and [Laa] at the lactate turnpoint (LT) and at the onset of blood lactate accumulation of 4 mmol/L (OBLA). (A) shows the determination of LT by log‐log transformation of [Laa] versus power output for both CPETs and both study groups. The intersection of the two regression lines defines the LT. Data points in (B) to (F) represent individual measures for each participant and horizontal lines are mean values. (B) shows the power output at LT for both CPETs and both study groups. (C) shows the [Laa] at LT for both CPETs and both study groups, while (D) shows the difference (Δ) in [Laa] between CPET1 and CPET2 for both study groups. (E) shows the power output at OBLA for both CPETs and both study groups, and (F) shows the difference (Δ) in power output at OBLA between CPET1 and CPET2 for both study groups.