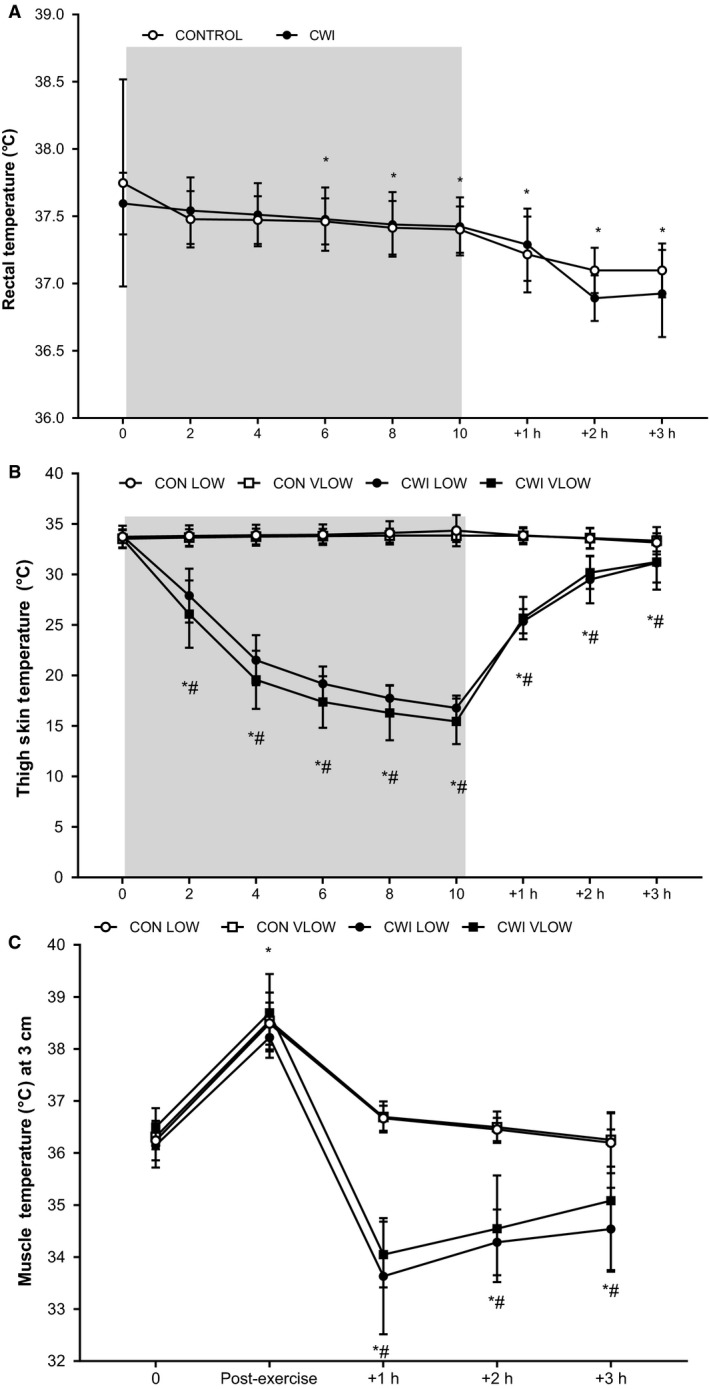
Figure 3.

Rectal temperature (°C) (a), thigh skin temperature (°C) (b), and deep muscle temperature (3 cm; °C) (c) during immersion and the 3 h post‐exercise period. *Significantly different from pre‐. #Significantly different from CON (n = 9 skin, n = 8 rectal, muscle; mean ± SD). Shaded area represents CWI.
