Figure 1.

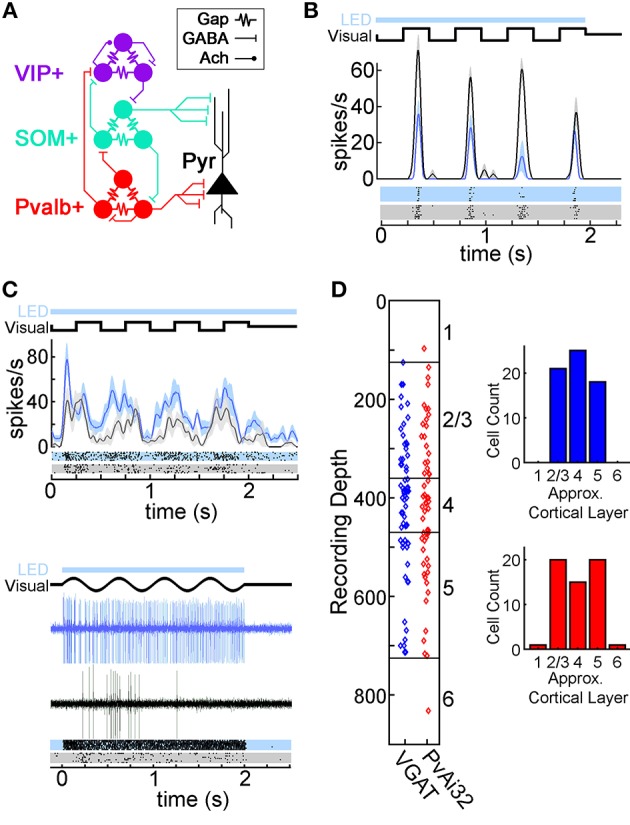
Optogenetic modulation of V1 neurons in transgenic mice. (A) Diagram of the proposed wiring of V1 local interneuron circuits described using in vitro methods (Pfeffer et al., 2013; Crandall and Connors, 2016; Karnani et al., 2016a). Pyramidal neurons (Pyr; black), and interneurons expressing parvalbumin (Pvalb+; red), somatostatin (SOM+; teal), and vasoactive intestinal peptide (VIP+; purple) are connected with electrical synapses (Gap) as well as GABAergic (GABA) and cholinergic (Ach) chemical synapses. (B) Spike Density Functions (SDFs) and rasters for a putative pyramidal neuron's response to drifting square wave gratings with (azure) or without (black) LED illumination. (C) Two photostimulated Pvalb+ neurons recorded in PvAi32 mice in the same format as (B). The SDFs and rasters for the top neuron show low intensity photostimulation elevated firing while maintaining important temporal features of visually evoked responses (see Methods), as well as eliciting several low latency spikes. The spike traces and rasters for the bottom neuron illustrate robust and low latency firing evoked by high intensity photostimulation (which was not used in the main dataset). For the example cells in (B) and (C), the timing of photostimulation (LED; light blue bar) and the visual stimulus (Visual; thick black line depicting the change in luminance of a point on the monitor over time) are shown above the SDFs or spike traces. Shaded regions on the SDFs in (B) and (C) indicate SEM. (D) Scatter graphs showing recording depths for VGAT (blue) and PvAi32 (red) transgenic mice. Approximate layer boundaries are indicated on the right vertical axis (Lein et al., 2007). Histograms indicating cell count distribution across approximate cortical layers are shown inset.
