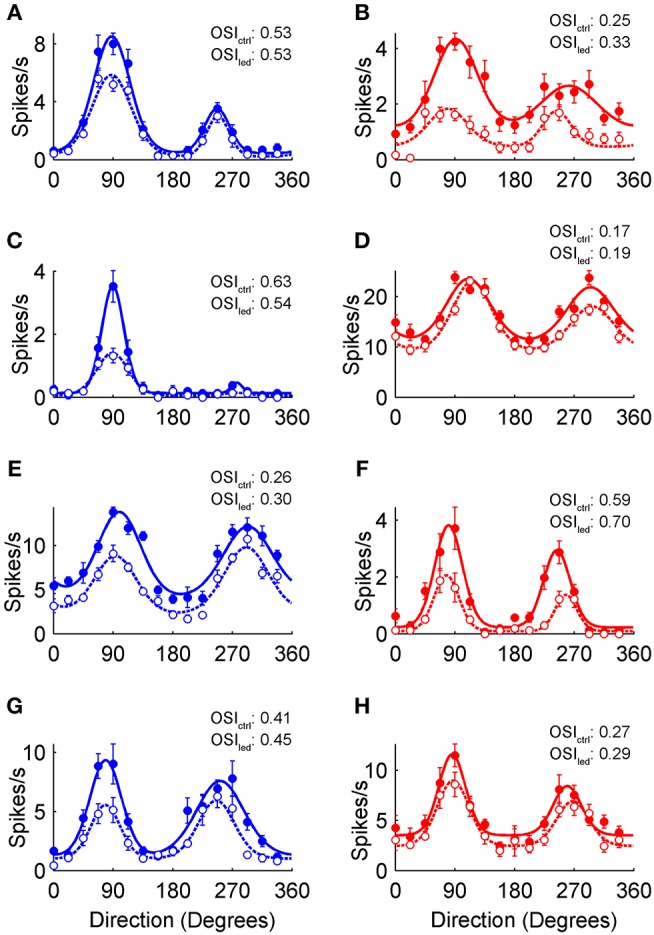
Figure 2.

Optogenetic modulation of V1 orientation tuning curves. (A–H) Orientation tuning curves from putative V1 pyramidal neurons recorded in VGAT (blue) and PvAi32 (red) transgenic mice. Solid and empty circles show mean firing rates for the control and photostimulated conditions, respectively. Smooth curves show double von Mises fits to control (solid lines) and photostimulation data (dotted lines). Error bars indicate SEM. The orientation selectivity indexes for control (OSIctrl) and photostimulated (OSIled) conditions are noted inset.
