Figure 3.

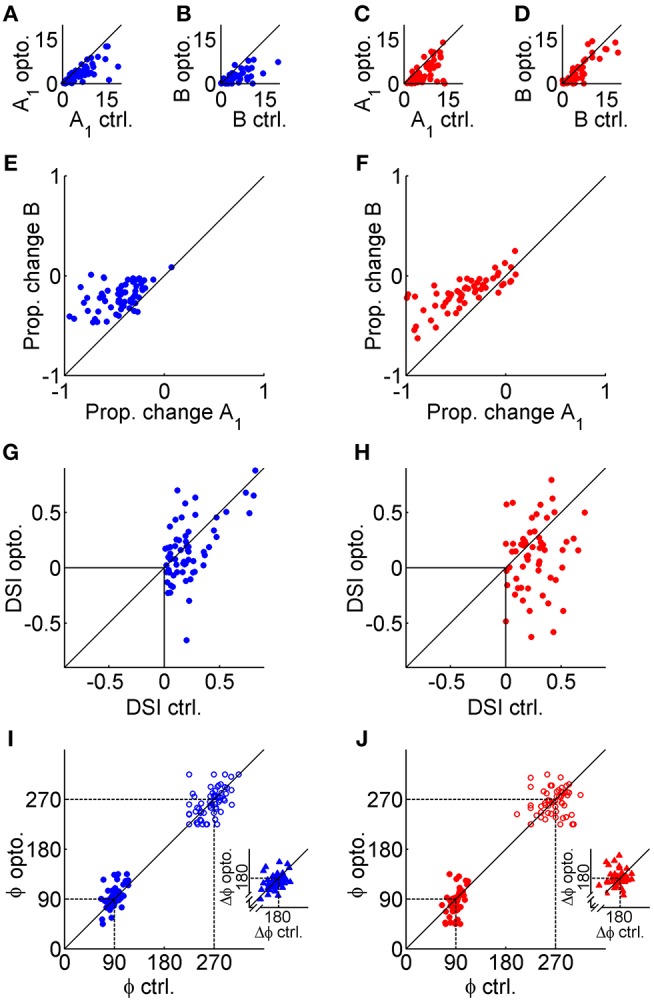
Population data obtained from double von Mises fits. The left column (blue symbols) shows data from VGAT mice, and the right column (red symbols) shows data from PvAi32 mice. (A,C) Scatter plots comparing peak firing (A1) in the control (ctrl.; abscissa) and photostimulated (opto.; ordinate) conditions. (B,D) Scatter plots in a similar format comparing baseline firing (B) in the ctrl. and opto. conditions. (E,F) Scatter plots comparing the proportional change in peak (abscissa) and baseline firing (ordinate). Note that photostimulation consistently produced larger drops in peak firing relative to baseline firing. (G,H) Scatter plots comparing the direction selectivity index (DSI) calculated in the control (abscissa) and photostimulated (ordinate) conditions. (I,J) Scatter plots comparing the preferred direction (ϕ) of the primary (filled circles) and secondary (empty circles) peaks in the control (abscissa) and photostimulated (ordinate) conditions. Inset scatter plots show the peak-to-peak distance (Δϕ) for control (abscissa) and photostimulated (ordinate) conditions.
