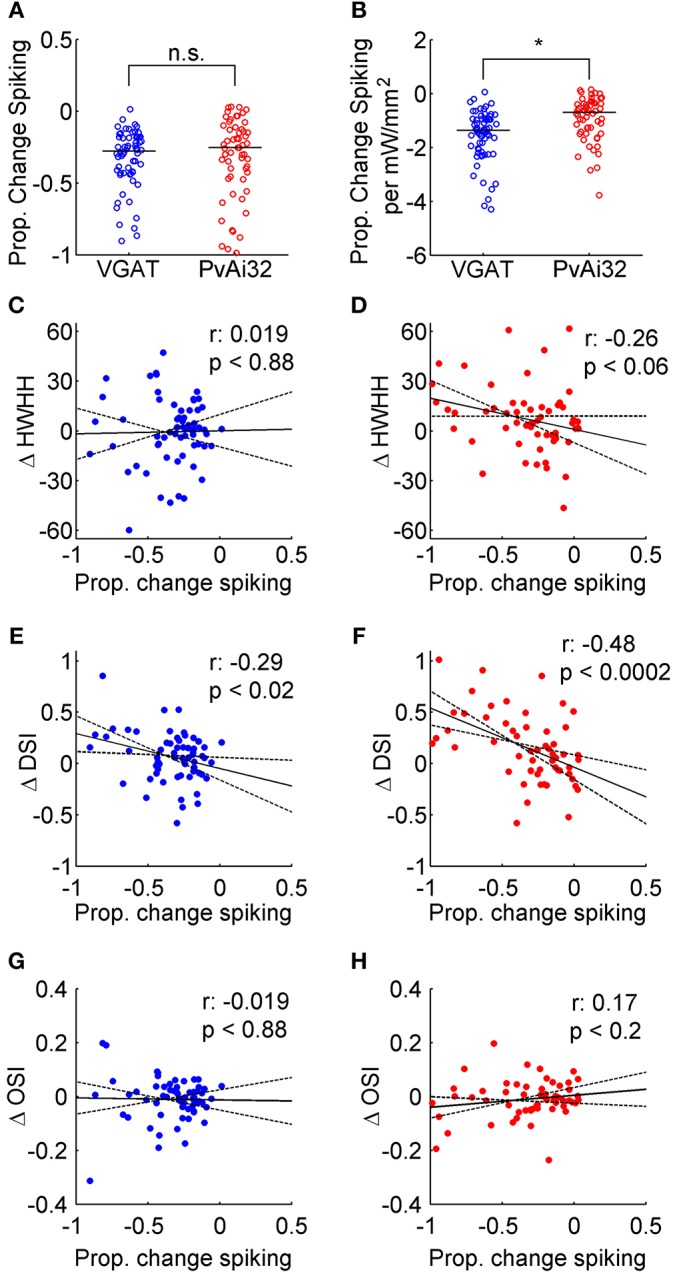
Figure 4.

Correlating optogenetically induced suppression with tuning curve changes. Blue symbols show data from VGAT mice and red symbols show data from PvAi32 mice. (A) Scatter column graphs comparing the proportional decrease in firing for VGAT and PvAi32 mice. (B) Scatter column graphs in a similar format to (A), but the proportional drop in firing was normalized by photostimulation irradiance. The population medians are shown as horizontal lines in (A) and (B), and significant (*) and non-significant statistical comparisons (n.s.) are indicated. (C,D) Scatter plots correlating the proportional decrease in firing induced by photostimulation (abscissa) with the change in tuning breadth (ΔHWHH; ordinate). (E,F) Scatter plots correlating the proportional decrease in firing (abscissa) with the change in direction selectivity index (ΔDSI; ordinate). (G,H) Scatter plots correlating the proportional decrease in firing (abscissa) with the change in orientation selectivity index (ΔOSI; ordinate). All correlation scatter plots (C–H) show the linear regression (solid line), the 95% confidence intervals for the regression (dotted lines), the correlation coefficient (r; top row inset) and p-value (bottom row inset).
