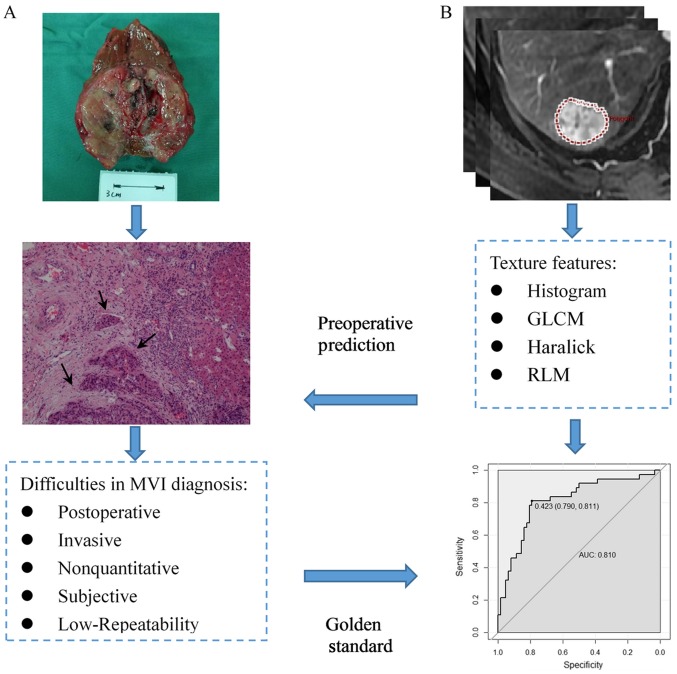
Figure 2.
Schematic diagram showing the MVI diagnosis based on pathological examination, prediction using texture analysis and their relationship. (A) Tumor cells could be found in the small vessels near the primary tumor lesion (black arrow). (B) The process of texture analysis includes image segmentation, feature extraction, statistical analysis and model building. MVI, microvascular invasion; GLCM, gray-level co-occurrence matrix; RLM, run-length matrix.

