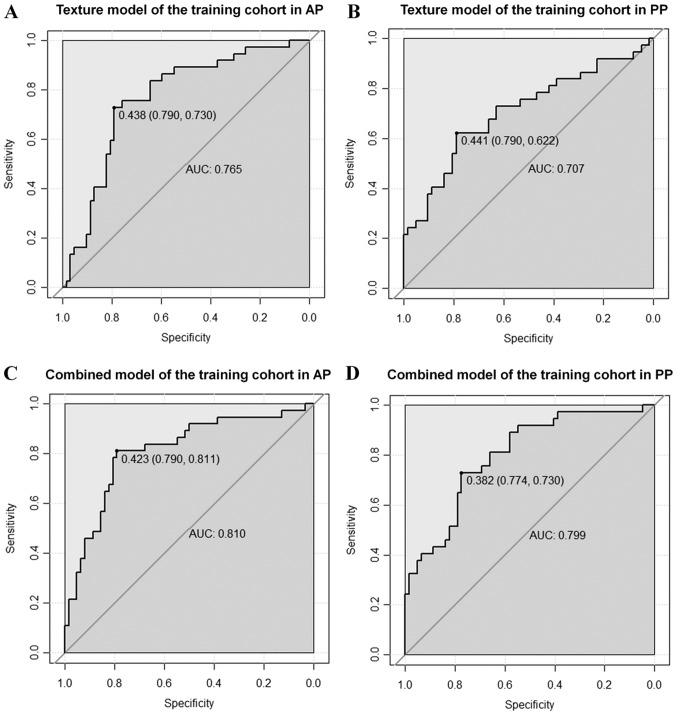
Figure 5.
ROC curves for the texture and combined models in predicting the microvascular invasion status in the training cohort. The solid dots represent the optimal cutoff values (specificity, sensitivity) for discrimination. The AUC for the texture models in (A) AP and (B) PP are 0.765 and 0.707, respectively. The AUC for the combined models in (C) AP and (D) PP are 0.810 and 0.799, respectively. ROC, receiver operating characteristic; AUC, area under the curve; AP, arterial phase; PP, portal-venous phase.

