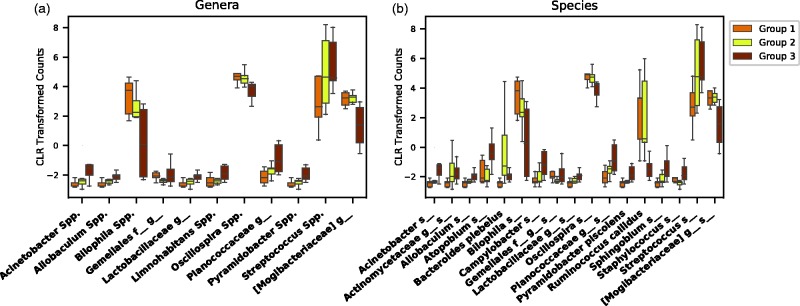
Figure 2.
Genera and species three groups’ analysis. Operational taxonomic units (OTUs) with at least one statistically significant comparison between two of the three groups are shown on genera (a) and species (b) levels. Significant differences were seen in 11 genera, and 17 species. Of note, many OTUs followed a stepwise increased/decreased relative abundance according to changes in renal function. CLR: center log-ratio. (A color version of this figure is available in the online journal.)

