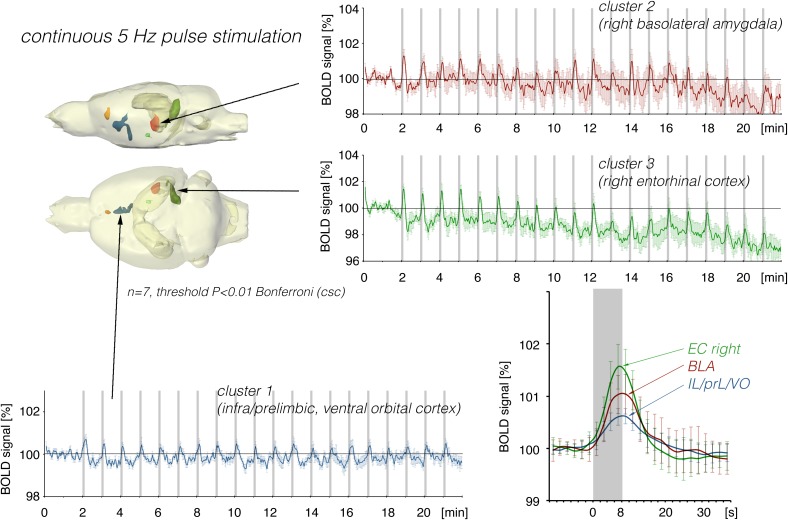
FIGURE 2.
Summary of BOLD responses induced by stimulation of the right LEC with repetitive 5 Hz pulse trains. Spatial distribution of significantly activated voxels revealed the presence of three main clusters of activation. BOLD time series of each individual cluster and event related averaging of all responses to train 3–20 indicate that the strongest BOLD response was induced in the lateral entorhinal cortex, whereas the smallest BOLD response was induced in ventral frontal cortical regions. The gray boxes indicate the time periods of stimulation.

