
Figure 1.
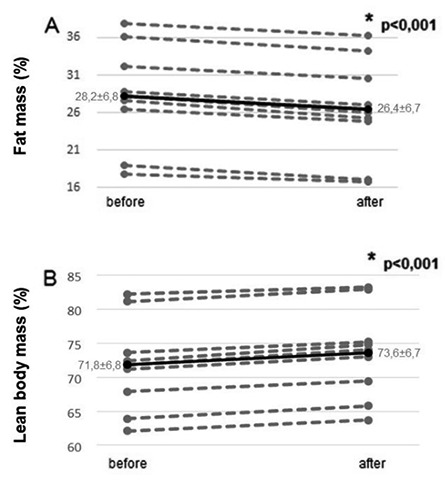
Variation of fat (A) and lean body mass (B) percentages of patients living with HIV/AIDS before and after submission to the training period. Full lines indicate the mean variation of all patients evaluated; dotted lines indicate the individual data of each study participant. P-value calculated by the Paired T test for related samples.