
Figure 1.
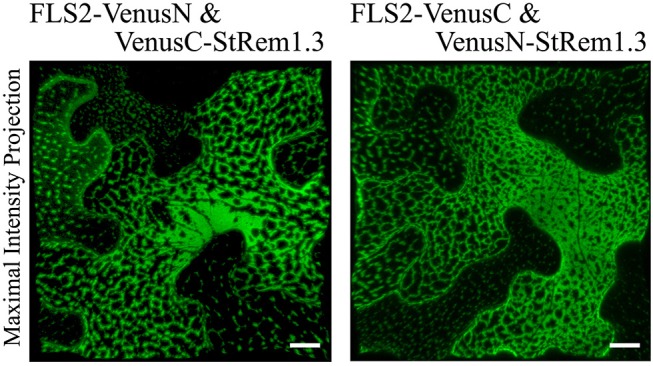
Heterogeneous distribution of FLS2-StRem1.3 BiFC complexes in N. benthamiana leaf cortical cells. Examples of BiFC fluorescence signals observed after co-expression of the following pairs of constructs: FLS2-VenusN and VenusC-StRem1.3; FLS2-VenusC and VenusN-StRem1.3. Scale bars represent 10 μm.