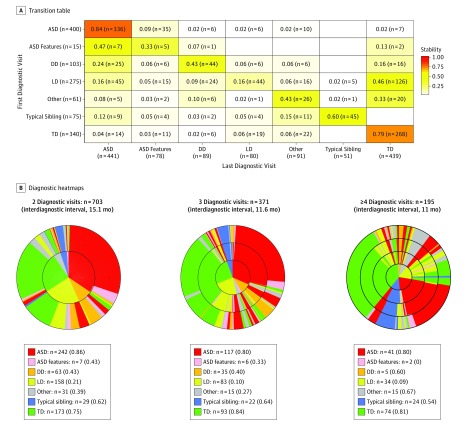
Figure 2. Transition Table and Diagnostic Heat Maps.
A, Summary of the proportion of toddlers from within the entire sample (N = 1269) who retained or moved to a different diagnostic group between their first and last diagnostic visits. Stability coefficients are denoted within each cell (coefficients are not adjusted for the age at first diagnosis; a high concordance with age-adjusted coefficients was observed) (eTable 4 in the Supplement gives coefficients adjusted for age at first diagnosis). To read the table, compare values across each row or vertically within each column. For example, of the 400 toddlers initially designated as having autism spectrum disorder (ASD), 336 retained this diagnosis at their last (final) diagnostic visit, yielding a diagnostic stability coefficient of 0.84, whereas 35 toddlers had ASD features but no longer met ASD criteria, 6 tested as developmentally delayed, 6 as language delayed, 10 had other developmental issues, and 7 were designated as typically developing with no residual symptoms. For transition tables with stability coefficients within 2-month age bands, see eFigure 4 in the Supplement. B, Changes in diagnosis across visits. Colors represent each diagnostic group and rings represent each diagnostic visit, with the smallest center ring representing the first visit. The left-most panel summarizes diagnostic changes for toddlers who received 2 diagnostic evaluations a mean of 15 months apart; the center represents toddlers who received 3 diagnostic evaluations a mean of 11 months apart; and the right-most panel represents toddlers who received 4 or more diagnostic evaluations a mean of 8 months apart. The heat map indicates that ASD was the most stable diagnostic category, and that toddlers initially suspected as having developmental delay (DD) or language delay (LD) frequently received a final diagnosis of ASD. TD indicates typical development.

