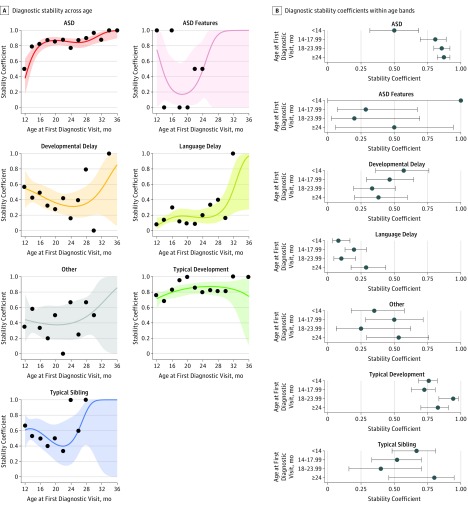
Figure 3. Diagnostic Stability Plots by Age at First Diagnosis.
A, Plots show diagnostic stability per group across 2-month age intervals based on the age at first diagnostic evaluation. Age intervals with missing data points reflect an absence of toddlers who received their first diagnostic evaluation at that age. B-spline logistic regression line is shown; bands represent 95% CIs for the fit line. Overall stability was highest in toddlers initially designated as having autism spectrum disorder (ASD) or typical development as illustrated by the relatively tight CI bands, and the largely consistent stability coefficients within each age band. B, Diagnostic stability coefficients in the 4 age bins used in the logistic regression model across diagnostic groups. The lines represent 95% CIs. Coefficients were estimated based on within group logistic regression models. eFigure 5 and eFigure 6 in the Supplement give complementary analyses.

