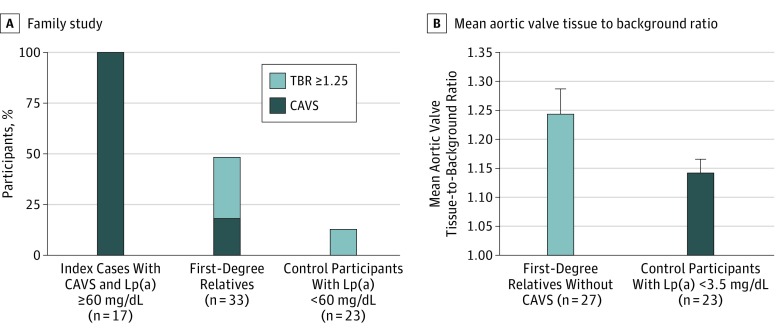
Figure 3. Distribution of Participant and Comparison Groups.
A, Distribution of patients with calcific aortic valve stenosis (CAVS) or a tissue to background (TBR) ratio of 1.25 or greater in the family study. B, Mean aortic valve TBR ratio in first-degree relatives without CAVS and control participants with low lipoprotein(a) (Lp[a]) levels.

